After getting my hands on a data set containing a large number of user reviews in a column, I was trying to get an overall sense of those reviews with a quick glance. Visually, there are several options to get that perspective. We can start by words used ranked by use count:
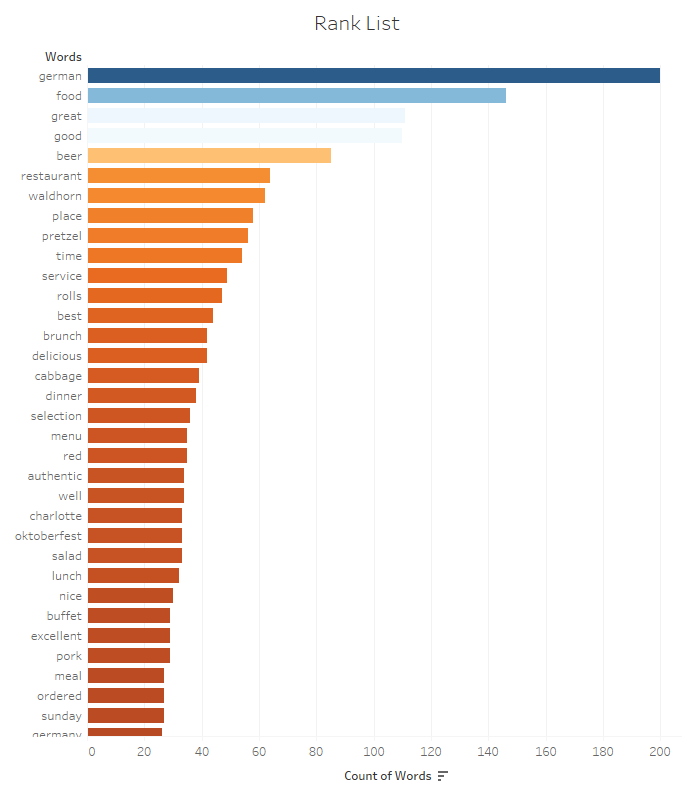
But it takes way too much of the screen real estate. We could also use a nice tree map, which I am found of:
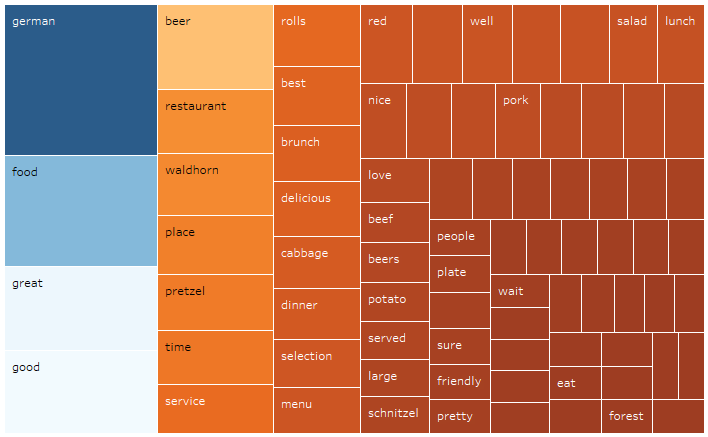
Nice and thorough, with each box sized in proportion of the use count of the word. Unfortunately, the average consumer of such analysis is struggling to interpret it, as this style of viz is probably not mainstream enough yet. It’s still way better than the dreaded pie chart, which is impossible to consume with more than 3 slices.
I figured this analysis could also be a great opportunity to use a Word Cloud, a fairly recent functionality which came with Tableau 8, which I find more accessible to users:
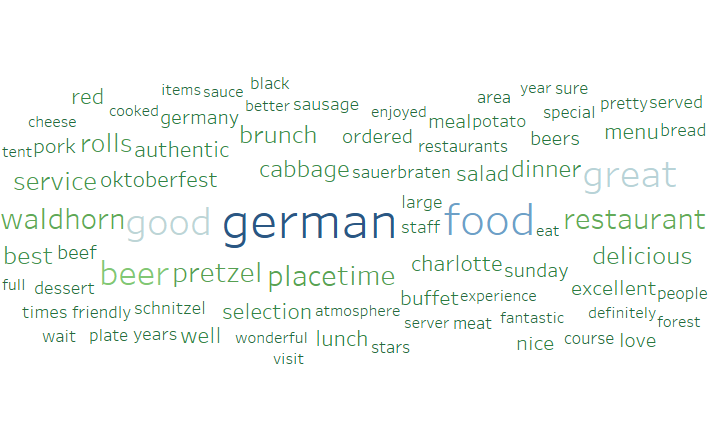
With one quick glance, one can clearly visualize that those reviews cover a German restaurant in Charlotte, NC, with a fairly positive tone.
Soon after I got started putting together the Word Cloud, I realized that Tableau offered little guidance on that topic. Word Cloud is not found in the Show Me tab for instance. I searched what fellow bloggers had to offer, and easily found some guidance, like here or there. These are all fine posts, with nice visual steps to follow, but they overlook a crucial point: they assume that the data set has already 1 word per column, which is highly unlikely to happen. It turns out that using a data source with sentences instead of single word, is a major road block to the use of Word Clouds in Tableau, as reflected in some help requests in the community. In order to feed Tableau with something workable, it requires to split the words of the reviews column. This operation implies breaking the granularity of the data source, which will expand the number of rows by the number of words found in each review.
There must be ways to code that conversion in Python, R, SQL or even PowerBI DAX. But as often for me, for a clean repeatable solution without dreaded copy + paste, whipped together in 10 minutes, I will use Alteryx!
For the demo, I will use a set of business reviews, mostly restaurants, from a well known review website. It is fairly large with almost 26,953 reviews, each in a row, for 1,298 businesses by 14,676 users. Here is the format:

My goal is to be able to get a Word Cloud for any business, one or many, or for any user, one or many, and be able to filter by votes, by stars, or date… Here is the workflow I generated to prepare the data for Tableau:

Notice the granularity along the workflow: we start with 27,290 rows and after the split get to over 3 million rows! This implies that the average review comprises 123 words. That workflow takes 1 minute to complete on my laptop.
- I load the Excel file, originally a CSV, then take out the Type field, since they are all reviews, and take out empty reviews by filtering them out, just in case. The blue box called All Sentences is a barely modified Tableau output I will use towards the end of that blog post, to use sentiment analysis. I will start with the Word Cloud fork which ends up with a pink box called Word by Word, my goal here.
- I insert a Formula tool with 4 steps:
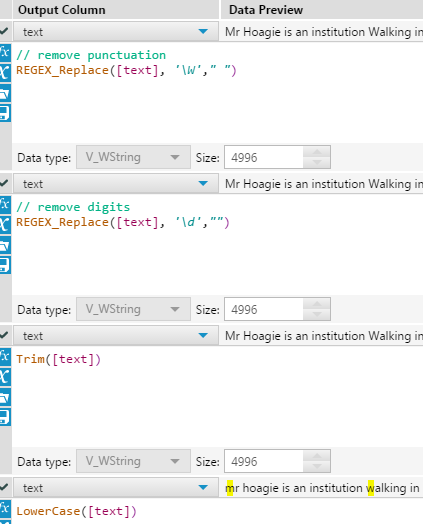 by applying those 4 steps in succession, I obtain a Text cell which contains only lower case words surrounded by one space. If I don’t convert to lower case walking and Walking will get separate counts.
 - Optional Summarize tool in case I want to collapse one of the dimension for my analysis. Let’s say I don’t care about the details of Users or reviews anymore and only need Word Clouds by Businesses. This implies collapsing all dimensions except business_ID, which will significantly decrease the number of rows to 1,298 before parsing:
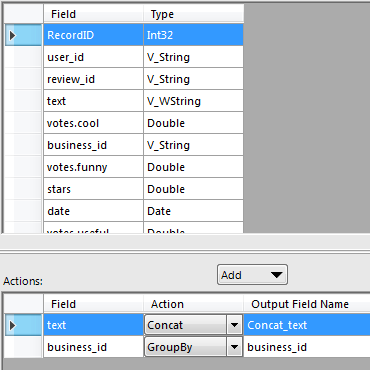
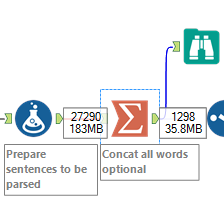
Note that in any case, you will end up with the same 3M rows at the end of the workflow, since we keep all the words… - The Text to Column tool will handle the magic:
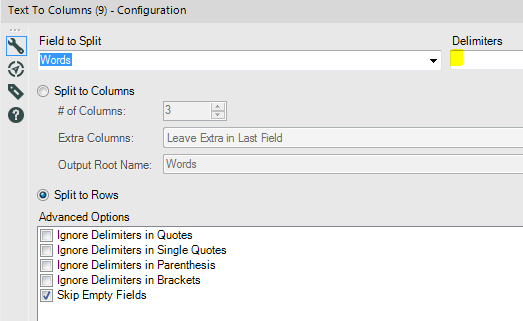 It will take every row and split every Text cell by the number of words, using space character as a delimiter, as highlighted above.
 - Before exporting to a TDE file ready to be used by Tableau, I use a Auto Field tool to fine tune the width of the Text Field to the width of the largest word found in the data set, 52 here:
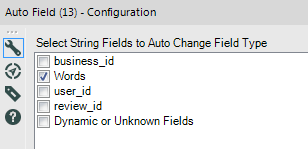
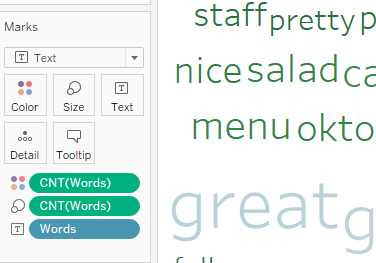
- Once loaded into Tableau, it is pretty easy to see appear the word cloud after a few clicks using this combination of settings:
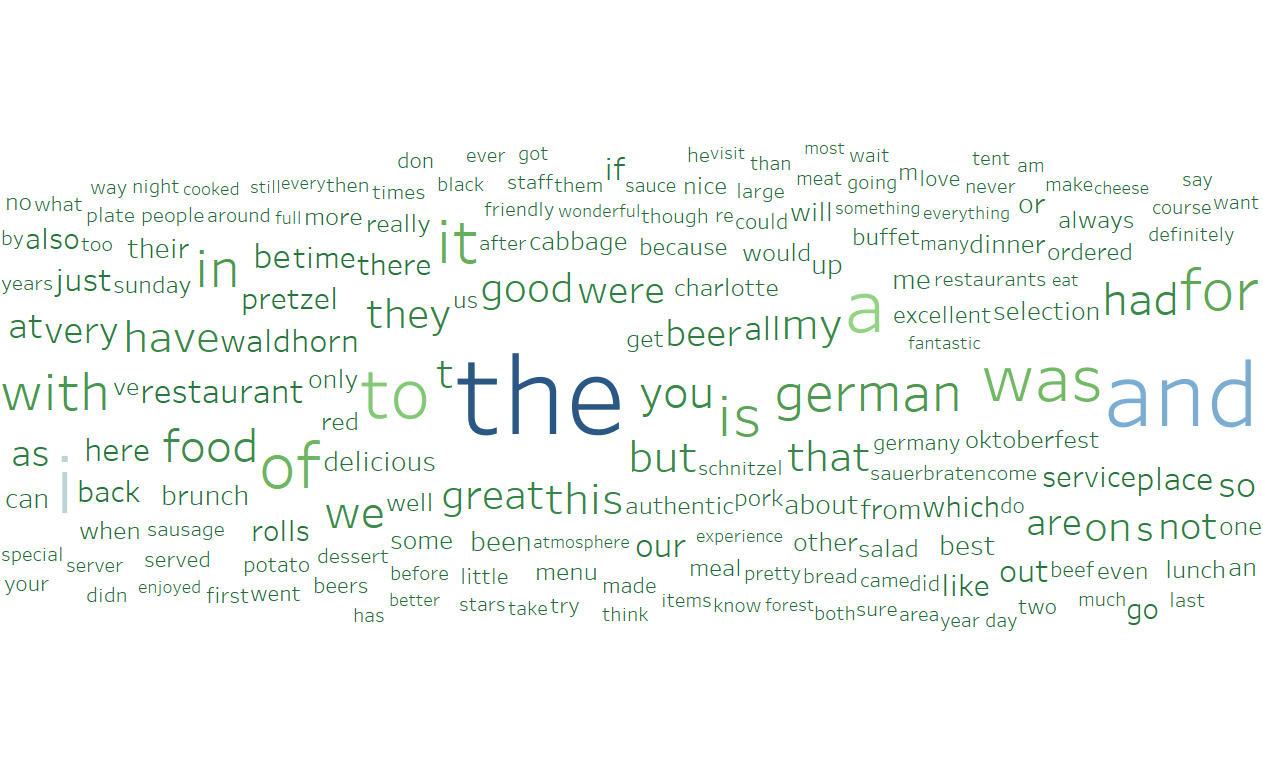
- Last but not least refinement, let’s remove stopwords to avoid seeing this Word Cloud, with prominent the and and which are not exactly informative:
 Even though, this could easily be done in Alteryx, I believe Tableau is indeed the best place to filter those most common words… To get started, let’s collect a list with a collection of stopwords relevant to the context of this analysis. I resorted to the MySQL list found here. Then create a Tableau Set called Stopwords by pasting the list in the Enter Text to Add window:
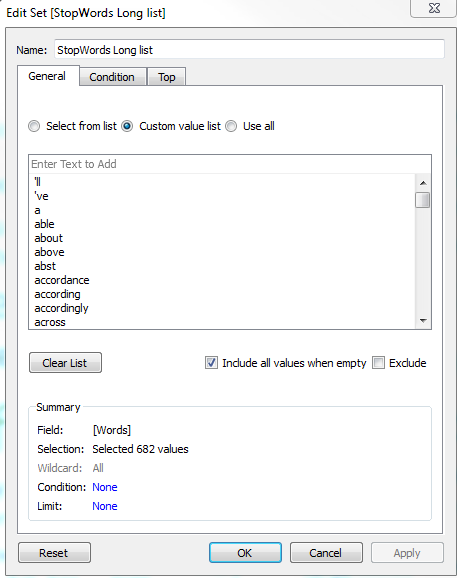 and proceed to drag the set into a filter for my viz, of type In/Out, which you will set to Out, to take out all of those meaningless words. The beauty of this approach is that you can easily tweak that list in the set, based on what you see, and play around with various lists. This is the artistic part of the analysis!
The result is compelling as stated in the introduction:
Word Clouds are quite useful for that quick glance, but a more advanced, and easier method from a certain perspective, can complement Word Clouds: sentiment analysis. A Sentiment algorithm will absorb the full text of the review and provide a sentiment score that will make it easy to rank those reviews accurately. With the inclusion of Python through TabPy in Tableau since the end of 2016, it becomes relatively easy to leverage existing libraries, as depicted here. I used the blue output of my workflow above to score the reviews with VaderSentiment and obtained this:
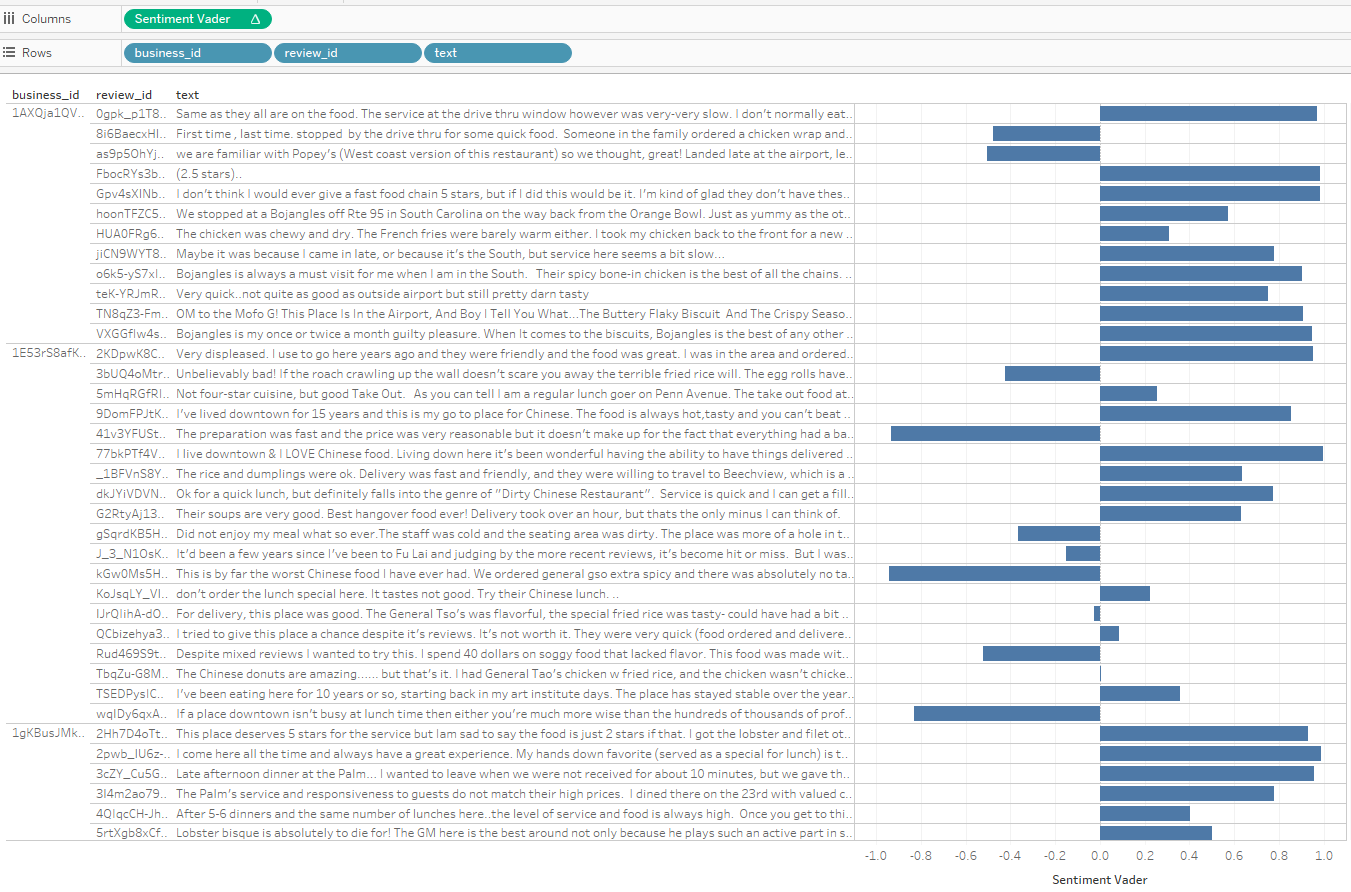
The results make a lot of sense, even though the integration of Python in Tableau is not for the faint of heart. Novices better keep out! I am looking forward to the implementation of Python in Alteryx, which will be smoother as the calculations will need to be performed only once during the workflow run, rather than waiting for 5 minutes each time the viz is modified in Tableau.

Great article! I would recommend using a calculated field which replicates all of the cloud words but with leading and trailing spaces. Two spaces (or a different number as desired) on both ends will greatly improve the readability of the cloud.
Pingback: Classify records based on keywords in a text field | Insights Through Data