Automate custom Tableau email updates

Like it or not, looking at you Slack, email remains the preferred way to disseminate information in the workplace. Even applications that help businesses run smoothly use email as a form of communication and efficiency. For example, the Sharepoint alert plus offered by Bamboo Solutions automatically send customized, conditional email notifications and reminders to push important updates and keep teams on track across projects. Volume is still growing, especially business emails volume growing at a cool steady annual rate of 7%. Is usage growing at the same pace? Meaning: are recipients actually reading those emails? That’s another issue…
Among your users, chances are that some are still heavily reliant, not to say tethered to email as they primary vehicle for sharing data. Even if you send a nice link to a perfectly crafted Tableau viz, they won’t click it, complaining it is too difficult to have to authenticate first, and wait for the browser to display, especially on a mobile device.

flying-emailsTherefore, there is still a case to be made for broadcasting data by email, as admitted very recently by Tableau. Starting with Tableau V10, you can finally subscribe on behalf of other users, whereas previous versions only let users subscribe for themselves. Tableau’s implementation is elegant and simple, as usual, but still comes with limitations:

  1. Each recipient must be licensed on the Tableau Server, which can get quite costly in a situation where you only need to send a sales updates to a large number of sales reps
  2. You are limited in terms of formatting options
  3. You cannot leverage existing Distribution Lists (DLs) maintained on your Exchange or other mail server

There is a better way, described in that post, that offers a much wider set of options, with a bit of R&D and very minimal coding. We will use a simple scenario: a large number of sales reps must receive a sales report by email at the start of their business day. This operation entails the following steps:

  1. Gather timely images of the reports out of your Tableau server, to be inserted in the email
  2. Put together a script to assemble the email and send it to a Distribution List
  3. Automate and schedule the task (optional)

Continue reading

Posted in Automation, Marketing, Sales, Tableau | Tagged , | Comments Off on Automate custom Tableau email updates

How to Calculate Headcount dynamically from Employees Transaction Records

Many business dashboards track headcount figures, since it is quite a vital indicator for most organizations. Conceptually, headcount is a straight forward concept. Technically, it is actually very complex to render for analysis, as it should not be stored, but calculated for a set of circumstances: Time, employee role, location, gender,etc.

Headcount is indeed very close technically and conceptually to inventory management, with flows of employees coming in and out the organization, and the required snapshot of where it stands It can also be used to see if improvements can be brought in to help motivate employees (such as the https://www.blueboard.com/blog/top-16-experiential-rewards-to-promote-employee-wellness systems that have started to appear across many industries). Headcount computing can be also compared to the approach needed for ROI calculation, as addressed in one of my previous posts. At a higher level of abstraction, a very good read by Keith Helfrich is diving into the similarity of those data sets. However, whereas Keith is using Custom SQL and Table Calcs in Tableau to reshape the data, I will take the Alteryx route, which I find cleaner, easier to explain and document. Continue reading

Posted in Alteryx, Tableau | Tagged , , , | 19 Comments

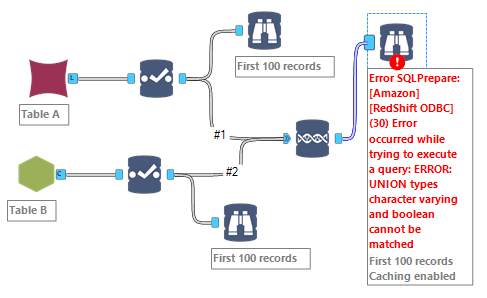
How to address INDB Union Error With Alteryx and Redshift

When playing with Alteryx on a Amazon Redshift database with INDB tools, have you ever come up with the impenetrable error:

Error: Browse In-DB (36): Error SQLPrepare: [Amazon][RedShift ODBC] (30) Error occurred while trying to execute a query: ERROR: UNION types character varying and boolean cannot be matched

Workflow 1

Redshift is kindly trying to tell you that some fields of the same name are formatted as Boolean on one side, and as VARCHAR / V_WSTRING on the other side. Now you are left with your own devices to identify which fields, which can be fun when dealing with tables of 100s of fields, the specialty of Redshift… Add to that challenge that the INDB Select tool cannot present the Data Type of the fields. On top of it, a weird bug, most likely in the ODBC layer, is presenting Boolean fields in Redshift as V_String in Alteryx… Are you about to toss the computer out the window yet? Wait, there is a way out of that misery…
Continue reading

Posted in Alteryx, Redshift, SQL | Tagged , , | Comments Off on How to address INDB Union Error With Alteryx and Redshift

Pathways to Analytics Automated Operations Nirvana

I already wrote a couple of posts on the topic of Automation of Operations using Alteryx, but I felt an update was in order, as the possibilities evolve so fast lately. I gauged some interest on the topic as well while presenting some of this content to an audience of data Analysts at Inspire 2016. Here is the video of the presentation.

As an Analyst, why should I care about Operations? In no particular order:

  • I want to deliver the freshest possible data, to ensure relevance, as business evolves fast
  • I want to expand my reach and cover new topics, while keeping the lights on those already proven valuable, and move on
  • I want to capture and code complex dependencies in my data, only once, when I discover them. Repetitive attention to the same tasks is a waste of my beautiful mind
  • I want to leverage more of the off hours processing cycles I have, by scheduling smartly

I understand that a lot of businesses don’t have their own analyst and instead outsource to a third party like understanding data, a data consultancy, to improve their operations. It definitely makes things easier; as the amount of data is just so large, it is difficult to ensure the right data is being used for financial gains while mitigating poor data. For companies that are just starting out or the ones who are yet to make the shift to the digital world, proper management of a huge database can be of high priority. Therefore, the need for data governance services for such companies is real, and a really smart way of boosting productivity. However, my company is lucky enough to have a team that analyzes and puts together data. Controlling Operations is also part of my vision for the agile Analyst, who’s on top of the whole chain of data, from the moment transactions get extracted from the source system to the moment analysis is consumed and interpreted by the largest audience of stakeholders. The Analyst can henceforth become confidently accountable for data integrity, as he can intervene at each step of the processing, between Alteryx and her publishing tool(s) of choice (Tableau, Power BI, Qlik, …).

Operations is a process traditionally covered by IT departments, right? Operations, which consist in automating a ad hoc analysis into a repeatable process that can be scheduled and monitored for data integrity, is definitely a more technical than business endeavour. IT managers spend so much time using resources such as time series analysis to ensure the data collected is relevant and helpful for the business to continue day-to-day operations. Yet, Alteryx makes it palatable enough for a non coding Analyst to run operations with minimal dependencies on IT, beyond the initial setup of servers and credentials. IT resource can then be allocated on more technical topics, with the analysts and their endless list of tickets off their back! This constitutes perhaps the next frontier attained by the Self Service Analytics revolution? Let’s shine some light on the options already available to Analysts…

Trade OffLike for many things, Operations require decisions along a trade off: Resiliency vs. Efficiency.

Efficiency involves complexity and dependencies, Resiliency involves simplicity and robustness. I see those choices as the fun vs. effort side of a game of tug of war. Alteryx offers a variety of options from Resiliency to Efficiency, and you can pick the most appropriate to serve your business needs, mix and match, evolve along the way at your pace, just like I do as I keep discovering new ways to automate. I will group those options from Resilient to Efficient this way:

  1. Simple Independent Schedules
  2. Normalized Sequential Workflows
  3. Scalable and Fast Complex Operations with a buffer Database

Continue reading

Posted in Alteryx, Automation, Performance, Power BI, Qlik, Redshift, Tableau | Tagged , , | Comments Off on Pathways to Analytics Automated Operations Nirvana

Overcome 10 Excel limitations with Alteryx

Various sources estimate that Excel has between 750 million and 1 billion users worldwide. Odds are that the vast majority of analysts start manipulating data with Excel. Beyond its ubiquity, and from my days of analytics at Microsoft, I have come to appreciate Excel for its versatility, for its expansion capabilities through plugins like this Excel plugin for TURF analysis, for example, and for a robustness that many software products could learn from. Let’s be clear, Excel is here to stay for many more years, with a deeply involved community. Loads of people are using Excel, and it’s easy to understand why. It’s fairly easy to use, however, some people might prefer to get some extra training in to make sure that they know exactly what they are doing. If you are interested in taking some extra classes then you could take a look at something like these excel classes to take in denver. There are loads of different classes out there, you just have to make sure that you find the right one for you. Before you take any class though, make sure that you do some research beforehand to make sure that you get the class you actually want.

I have been using Excel a lot, and I even keep writing on the topic, including in this blog. Yet, I find myself using Excel+ PowerPivot less and less. The first strike was when I started to use Tableau and realized that a stacked bar chart did not have to be so painful and time consuming to produce, as it still is with Excel. The second and near fatal strike came when I started using Alteryx, looking for a way to automate repetitive tasks, without tedious Visual Basic, and most important: without Copy & Paste.
No more CTRL

If you have a process that requires Copy & Paste, you should know you have outgrown Excel.

As I moved along the experience curve using Alteryx, I discovered 9 additional benefits, less obvious, that I gathered and will detail in that post:

  1. Build Once, repeat automatically and reliably
  2. Modular design for sharing
  3. Change data type
  4. Obfuscate easily
  5. Identify what did not match in a Vlookup or an Index/Match
  6. Import many sheet
  7. Union of tables
  8. Reshape Data
  9. Increase Data Granularity
  10. Decrease Data Granularity

Continue reading

Posted in Alteryx, Excel, Performance | Tagged , , | 10 Comments