Turn text column reviews into a Tableau word cloud

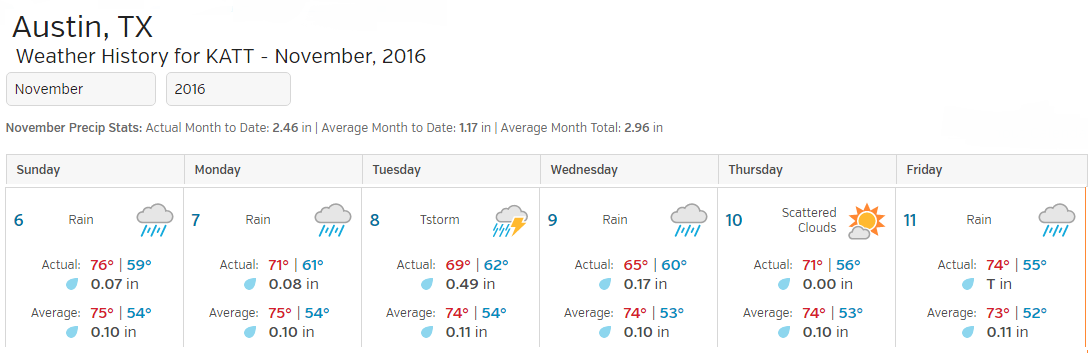
After getting my hands on a data set containing a large number of user reviews in a column, I was trying to get an overall sense of those reviews with a quick glance. Visually, there are several options to get that perspective. We can start by words used ranked by use count:

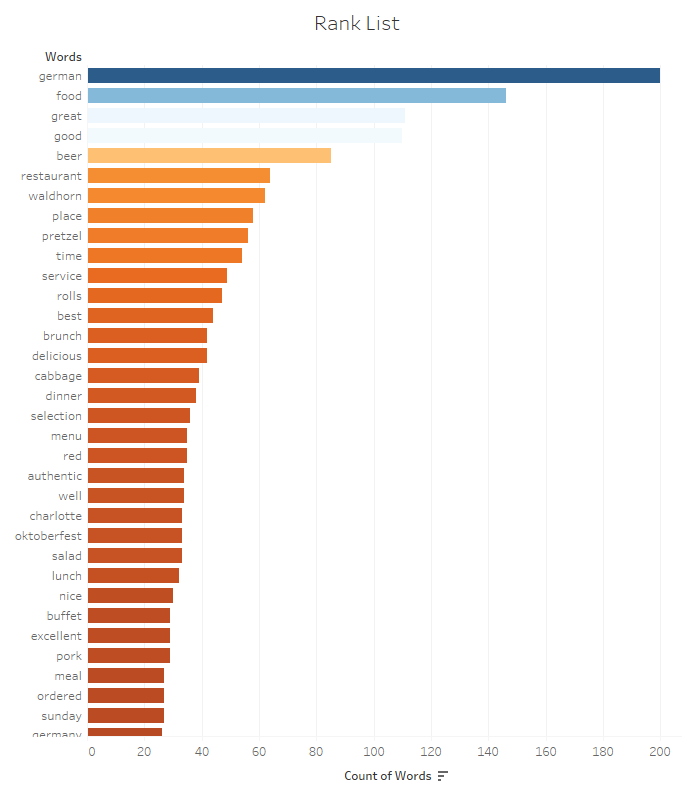
But it takes way too much of the screen real estate. We could also use a nice tree map, which I am found of:

Nice and thorough, with each box sized in proportion of the use count of the word. Unfortunately, the average consumer of such analysis is struggling to interpret it, as this style of viz is probably not mainstream enough yet. It’s still way better than the dreaded pie chart, which is impossible to consume with more than 3 slices.
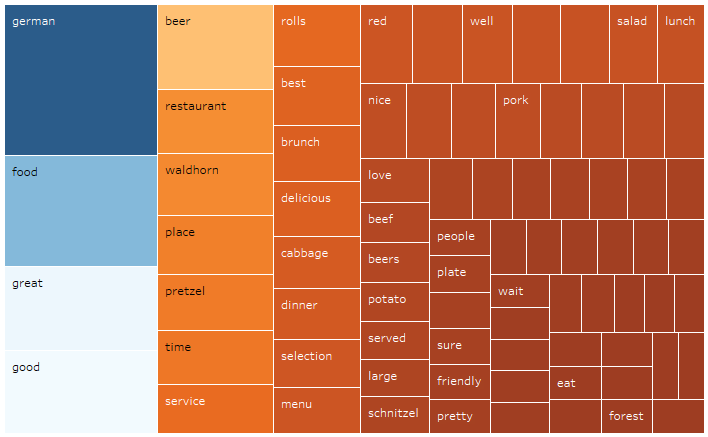
I figured this analysis could also be a great opportunity to use a Word Cloud, a fairly recent functionality which came with Tableau 8, which I find more accessible to users:

With one quick glance, one can clearly visualize that those reviews cover a German restaurant in Charlotte, NC, with a fairly positive tone.

Soon after I got started putting together the Word Cloud, I realized that Tableau offered little guidance on that topic. Word Cloud is not found in the Show Me tab for instance. I searched what fellow bloggers had to offer, and easily found some guidance, like here or there. These are all fine posts, with nice visual steps to follow, but they overlook a crucial point: they assume that the data set has already 1 word per column, which is highly unlikely to happen. It turns out that using a data source with sentences instead of single word, is a major road block to the use of Word Clouds in Tableau, as reflected in some help requests in the community. In order to feed Tableau with something workable, it requires to split the words of the reviews column. This operation implies breaking the granularity of the data source, which will expand the number of rows by the number of words found in each review.

There must be ways to code that conversion in Python, R, SQL or even PowerBI DAX. But as often for me, for a clean repeatable solution without dreaded copy + paste, whipped together in 10 minutes, I will use Alteryx!

Continue reading

Posted in Alteryx, Tableau | Tagged , , | 2 Comments

YoY YTD dashboard made easy in Tableau

When using a set of dated transactions which gets updated, how do you provide a report which will track visually a monthly  YoY (Year over Year) YTD (Year to Date) comparison? This needs to work at the day level, to avoid comparing June 1 attainment this year to all of June the year before…

It would be easy to build a table in Excel, massage it until you get a side by side. But then, so much for automation! And it is actually faster to obtain in Tableau, as long as you have the underlying transactions with dates. Yet, in Tableau, it is not as easy as it seems, and there are quite a few people who have been looking into that issue. Since I struggled with table calcs which behave quite finicky for that task, I came up with a solution that will work for any calendar dimension (Day, Week, Month, Quarter). Don’t expect anything revolutionary here, but a nice handy trick, much easier imho to understand and deploy than Tableau’s official guidance.

Continue reading

Posted in Performance, Quick & Dirty, Sales, Tableau | Tagged , , | 8 Comments

Alteryx v11 after 100 days

As far as Alteryx major releases go, V11 was appealing with many feature enhancements, in no particular order:

  • A modern web based job scheduler
  • A modern formula editor, which makes Excel blemish with its autocomplete and data preview window
  • Addition of SAP Hana, Microsoft Azure SQL Database, Microsoft Analytics Platform System, and Netezza as IN-DB connectors. Welcome to the IN-DB club, you will love it!
  • Global Search, which helps finding all relevant information from within Alteryx
  • Data Profiling, which is an odd way to describe the new Browse Tool. Browse has learned new tricks! That page is supposed to describe those, but I suggest you watch the video, the text won’t tell you much.

Using that version of Alteryx for over 100 days now, my experience turns out to be very different than what I was expecting after going over the description of those enhancements. I feel that one of them is a sleeper hit for data analysts.
Continue reading

Posted in Alteryx, User Experience | Tagged | Comments Off on Alteryx v11 after 100 days

10 Tricks to adopt Redshift In-DB

If you are still manipulating data in Excel, why should you care about In-DB and Redshift? Whether you are accessing your Redshift data through Alteryx or through Tableau, knowing how to prepare your data within Redshift, with In-DB tool in Alteryx or with a prep query in the Tableau connector to Redshift, will give you access to another level of performance and flexibility. Even though it might sound to you like science fiction, it is not… These are just Redshift functions you can run through ODBC

Having a Database to read from and write to, is really nice when using Alteryx, even though you can make do without, with local .YXDB files. The key benefit of a dedicated database is the ability to use In-DB tools. Working In-DB saves the time it takes to import and export data to and from the Alteryx engine memory, and leverages the power of the DB engine. Shifting an analyst’s data Field of Play to a Massively Parallel Processing (MPP) Database such as Redshift, brings additional performance improvements. I would deem those gains massive: I have seen 6 minutes Alteryx workflows run in 15 seconds In-DB. Note that besides Redshift, the following databases are supported In-DB by Alteryx:

  • Cloudera Impala
  • Databricks
  • Hive
  • Microsoft Azure SQL Data Warehouse
  • Microsoft SQL Server
  • Oracle
  • Spark
  • Teradata

For all the wonders of the Alteryx data engine, which never seems to choke on anything sent its way for processing, it cannot really compete with the parallel processing of Redshift, when used In-DB. From an analyst perspective, there are some trade-offs for the additional performance, scale and efficiency. Main one is the steep initial learning curve, since it requires the adoption of a wholly different set of tools. Furthermore, you will quickly find that those tools have limitations, inherent to the underlying SQL operations generated through ODBC. The 10 tricks of this post will hopefully alleviate some of those difficulties. If you’re still not too sure about your SQL operations. Check out red9 for any further support.
Continue reading

Posted in Alteryx, Performance, Redshift, SQL, Tableau | Tagged , , , , , | 1 Comment

TC16 Tableau Conference Highlights

This year’s conference took place in Austin, TX. Yet, our Tableau friends must have felt right at home, as if in Seattle. The constant drizzle and low ceiling were certainly more reminiscent of a Pacific Northwest scenery. It took until Thursday at noon, tail end of the event, to catch a glimpse of sun:

austinrain
Continue reading

Posted in Tableau | Tagged | 4 Comments