
As far as Alteryx major releases go, V11 was appealing with many feature enhancements, in no particular order:
- A modern web based job scheduler
- A modern formula editor, which makes Excel blemish with its autocomplete and data preview window
- Addition of SAP Hana, Microsoft Azure SQL Database, Microsoft Analytics Platform System, and Netezza as IN-DB connectors. Welcome to the IN-DB club, you will love it!
- Global Search, which helps finding all relevant information from within Alteryx
- Data Profiling, which is an odd way to describe the new Browse Tool. Browse has learned new tricks! That page is supposed to describe those, but I suggest you watch the video, the text won’t tell you much.
Using that version of Alteryx for over 100 days now, my experience turns out to be very different than what I was expecting after going over the description of those enhancements. I feel that one of them is a sleeper hit for data analysts.
Among those enhancements, I experienced some let downs, such as the formula editor, which turned out to not enhance my productivity, just made me waste some cycles to find my bearings and adjust to the new experience. I’ll admit that the new experience is much prettier, and a useful enhancement for new users ramping up with the product.
Another frustration for grumpy old timers like me, was the Global Search: looking for a tool by name, without knowing its location in one of the many tool bars. The tool does show up as a result in the search bar, but clicking it will not take you to its location anymore. Clicking does nothing. I found out after quite a while, that you can drag that tool from the search result into the canvas, without going through the step of locating. I suppose it is designed for efficiency, but I still would like to know the location in the tool bars, if only for next time…
The big reveal of that V11 release, the game changer, and I weigh my words, turned out to be the new Browse tool / Data Profiling feature. It took me way too long to seize the magnitude of that change, and to realize how much it boosted my productivity, I am hoping this blog post will help you too…
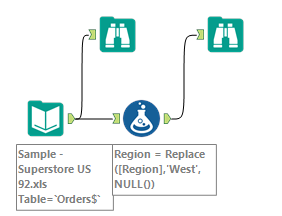
Since V10, I had mostly stopped using the Browse tool, as it is built-in with a partial view in most tools.So I really stumbled upon the new version of Browse in V11, as I needed to export the content of a Browse to a spreadsheet for debugging. I was surprised to find in that new version of Browse tons of useful data profile information which now save me critical amount of time when developing or debugging workflows. Here is an illustration using the infamous Super Store data set, specifically the Orders table:
That first Browse gives me this when selecting the Order Date column:
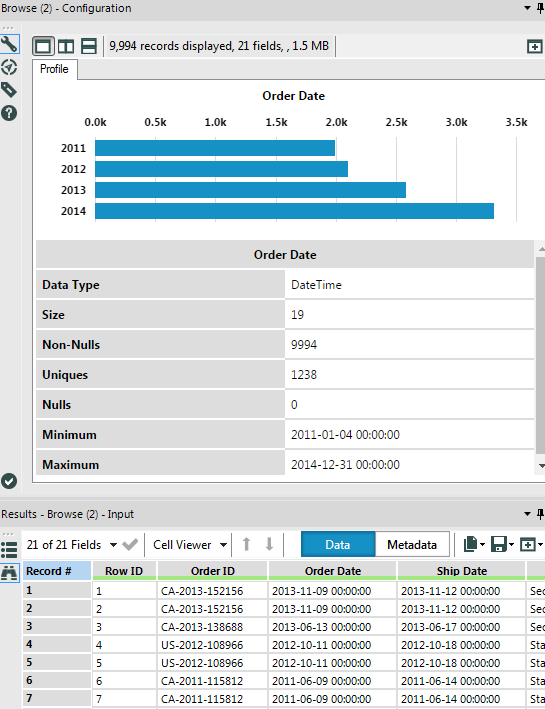 I get almost instantly the distribution by year of my orders, the # of unique values, and most importantly, the # of null values, very handy when evaluating a new data set or when tracking bugs.. Here is what happens when I select Region:
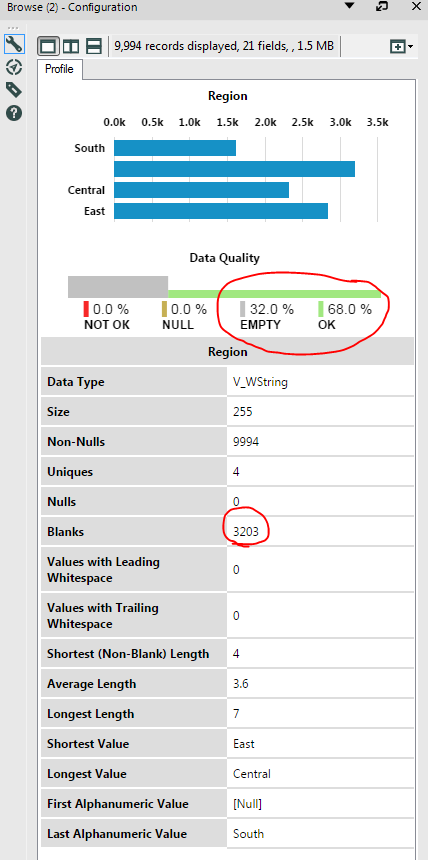
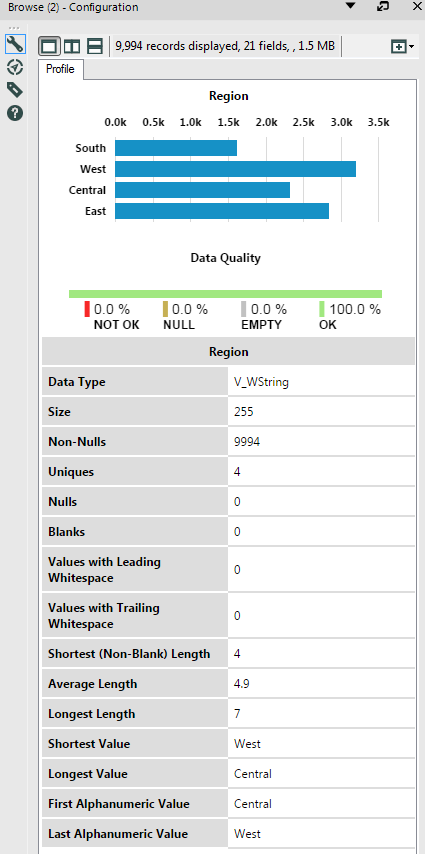 Let’s give it to the Super Store data set, it is clean! No Nulls nor Blanks, only 4 values, just what I would expect to see! Now if I mess with it by deleting the West value in my workflow for illustration, here is what the second Browse shows:
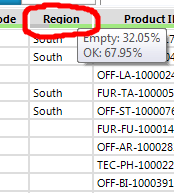 The bar becomes only partially green, warning me the field is not populated for 32% of entries, and I can see right away that I have 3,203 Blanks:
 It does not look like much, but because it is so well located in the browse, and so inconspicuous, loading so fast in the background, it changed the way I hunt for bugs and find them. No more need to filter or sort those rows, the potential issues are springing to my sight. I used to have to export the content of Browse to Excel to be able to massage it and find the odd pattern, this has become moot, to my elation!
That alone makes the upgrade to V11 a must. I didn’t see it coming, but I wonder how I have operated without it for so long…