Have you noticed that ominous warning every time you connect to Google Analytics (abbreviated to GA for the remainder of this post)?

Yes, the Google Analytics you have used and loved (mostly because it’s free, admit it…) is about to get a major upgrade starting July 2023. Some sites have already switched to the new version, which is fully rebuilt, all the way to the API. This means that all existing connectors need to be rebuilt as well, and not everybody is ready… Alteryx offers a standard connector to the current GA, called UA for Universal Analytics. Yet, no Alteryx GA4 connector set to be available before spring 2023 at best. You are pretty much on your own if you need to import GA4 transactions earlier…
Well that’s a great opportunity to build a quick & dirty custom API connector, understand the process and access all the levers offered by the enhanced API… You can gain a lot of time by downloading the workflows from the bottom of this post, but be aware that the solution is way less polished than what Alteryx will subsequently release. It will do the job in the meantime.
To get acquainted with the changes GA4 brings over UA, Google offers a great resource here:
https://ga-dev-tools.web.app/query-explorer/
which lets you switch between UA and GA4 with an actual switch:
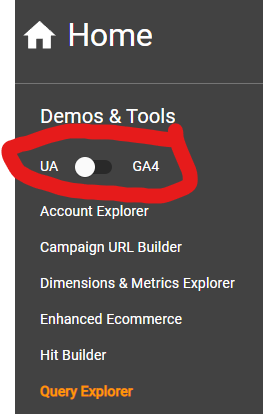
You can observe that in GA4, the query commands (dimensions and metrics) in the API call are not found in the parameters anymore, but instead within a JSON array in the body payload. You will note, as well, that the naming of metrics and dimensions has evolved…
What do I need to query the GA4 API?
There are really 3 key elements you will need, to assemble to query the GA4 API in Alteryx and retrieve data sets. The good news is that 2 of them are really easy to get! Here they are, ranked by growing level of difficulty:
- Property ID for the URL
- Query Commands (Payload)
- Authentication