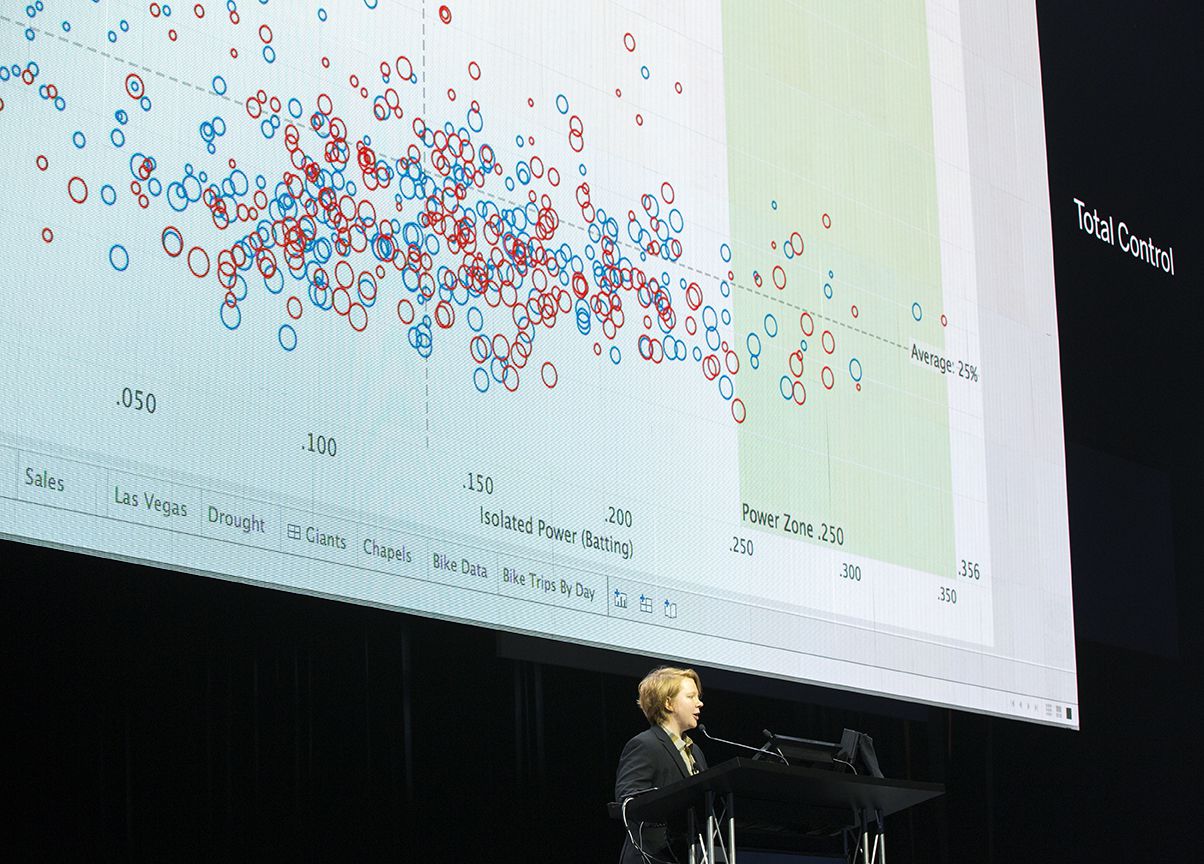
This year’s Tableau Conference in Las Vegas was a good vintage, it was large and crowded for sure, but loaded with good content and some spectacular product announcements.
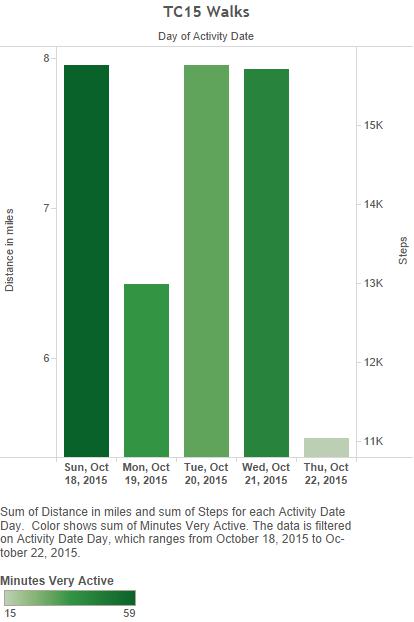
With 11,000 attendees, the 2015 edition almost doubled the size of Seattle’s 2014. It was great to run into prominent members of the Tableau community such as God himself Joe Mako, but also Ken Black, the Ace team from Information Lab, or John Mathis. On the flip side, I barely got a chance to engage them as the crowd flows was carrying us apart. The sheer size of the event also meant a lot of walking, as my Fitbit data can testify in this following Tableau viz, using Craig‘s handy Web Connector:
Yes, that’s 36 miles in 5 days, not too shabby without sneakers…
There were really a LOT of folks to share space with, facing lines most everywhere. Getting out of the keynote venue for instance was a 30 minutes effort at best:
 Click that picture to see the full panoramic detail. Another cramped place was the übercrowded party on Fremont Street, check out this panoramic picture or just this one I took:
 I got the chance to zip line on top of the crowd, quite an experience, see how high is the first step:
 And yes, I’ll admit I didn’t have the gall to take pictures while on the zip line. Unlike some peers, I follow safety rules, what can I say…
Switching gear to the learning part of the conference, there was much knowledge exposed and much inspiration to draw from. With over 300 sessions, there were some difficult choices to make among sessions to attend in person. Nevertheless, I am psyched that this year for the first time, the videos for most sessions are already published, quite a feat. Among those I attended, here are some of my favorites in no particular order:
- Using Tableau to Determine Marketing Attribution: I am not alone working on this harduous topic! Tableau was sharing their internal progress towards the Holy Grail of measuring the impact of Marketing campaigns and ROI, using R modules to assign weights and LOD expressions for flexible refreshes and data exploration
- TabCmd for Tableau Commandos: Simple but useful techniques to automate tedious tasks, that I had overlooked. Inspired me to work on a solution to subscribe internal mailing distribution lists to Tableau Server reports.
- The New Tableau Web Data Connector: By Zen Master and Alteryx Ace extraordinaire Craig Bloodworth, who presented Web Data Connector techniques to the non coding masses. Craig really inspired the full room to get cranking on Javascript to easily import and refresh web data into Tableau.
- Optimizing Calculation Methods: a no nonsense hands on training to figure out when to use what, with twisted vizzes and clear explanations. I’m glad I got through that one in person since they are not filmed, and the content was very advanced
- LODs of Fun with Jedi Filters: Very creative ways to use LODs, anchored in real life cases as the speaker is a presales consultant working with customers all day. Inspired me to improve my existing models to take advantage of the powers of this fairly recent Tableau feature.
The product announcement keynote was the most anticipated milestone, and did Tableau deliver! Here are those that most impressed me:
- Launch of Vizable: a free app to play with data on iPad. Great experience, but still not sure about the business model there? It sure does look like a lot of resource has been invested in the baked version of Project Elastic, shown last year.
- Improvements in Data Preparation:
- A Union feature to combine multiple Excel files: It used to take Alteryx to be able to perform quite a common task. Alteryx will still be a must have to operationalize such process.
- Cross Database joins: Useful for quick prototypes, not sure how well it will withstand production…
- New Viz Features:
- Highlighter to view a group of data without filtering, brilliant!
- Support for geospatial files and Mapbox datasets, overdue…
- Tooltip vizzes! Lets you insert a subquery inside the tooltips using context. It looked so easy to implement and I am surprised they made it work without performance hit…
- Last but not least, positioning of Grand Totals to the top of a view!! Really overdue as well, for lists that take more real estate than a screen… Now, if only Tableau could provide keyboard shortcuts to enable/disable Totals and Subtotals, I’d be a happy camper and that could shave cumulative hours while manipulating data. Why forcing us to wade through levels of menus?
- Analytics: After bringing forecasting with regressions to the masses, Tableau did it again with outlier detection and clustering. You have to see it, to believe how they simplified those processes so much. Now even users without a PhD will be able to explore and prototype complex clusters in minutes.
- Server: Version control and better search are welcome additions, quite overdue as well…
- Dashboards:
- Cross database filtering: quite impressive if it works as well as the demo did
- Device format conversion: no more hours spent to customize different dashboard layouts for different devices. Another great productivity boost!
- First iPhone native app for Tableau confirms the Apple love theme playing at Tableau since last year, between Vizable for iPad only and the Mac version of Tableau, plus the majority of Tableau presenters using MacBooks. For a moment, one could believe Tableau HQ was located in the Bay Area, instead of near Microsoft HQ in Seattle…
That session has been captured on video, and is well worth your time watching for free here. Go to Live sessions and watch Tableau Keynote: Developers on Stage. The developers did a really good job demonstrating the features in context. Seeing is believing, but I bet not all these features will be found in version 9.2. There was quite a shroud of mystery and frankly, lots of confusion over availability milestones. It is best to sign up for the 9.2 Beta, as I already have!


Pingback: Beatles Viz, TC Recaps among Best of the Tableau Web – bis-soluciones.com.mx
Pingback: TC16 Tableau Conference Highlights | Insights Through Data