Marketing ROI is a vast topic, top of mind for most CMOs who feel accountable for their budget. Yet, that topic is not well established academically, and even less technically. A simple search on Amazon shows some books addressing the topic, with very few reviews. Their content comprises mostly frame works: a lot of theories, some formulas and only a few tactics.
In this post, focused on B2B Marketing, I will illustrate how to publish comprehensive data to analyze and empower Marketing stakeholders, based on a simple revenue to cost formula:

Campaigns’ influence on the revenue (Multi-Touch Attribution) divided by their cost. The goal of this blog post is to roll up the sleeves and present fresh ROI for any marketing campaign, for any month, and aggregate on the fly to Quarter or Year.
This approach has been successfully implemented at Alteryx, and covers the full extent of the Marketing activity, thanks to the processing power of the tools involved: Marketo, SFDC, Alteryx Designer and Tableau.
Input
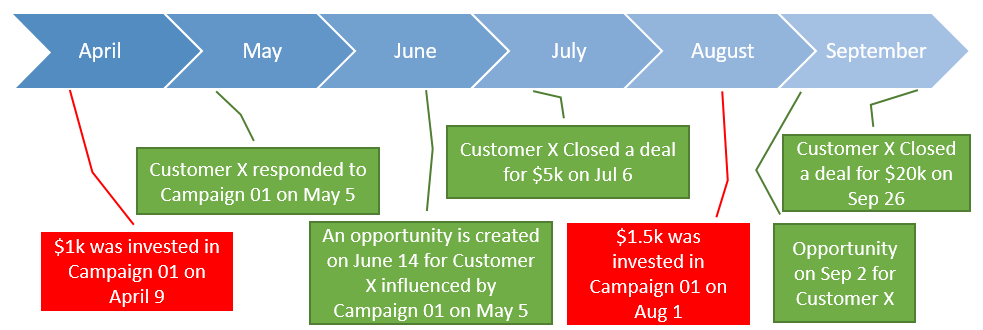
With the combined wonders of Marketing Automation and CRM, modern marketing deployments capture a wealth of transactions. Here is a simplified illustration of one scenario for one campaign and one customer, revenue in green, costs in red:
Desired Output
Using the transactions depicted above, the ROI statement displayed for July would look like this:
 While a ROI for Campaign 01 of 5X in July looks pretty good, the campaign will keep performing and its influence needs to be measured continually, with or without additional investment. Here is how it would look like in October:
 These indicators are quite bare bone, and are meant to reflect the lifetime of the campaign. Yet they should be designed for historical views, like timed snapshots. Users could then compare campaigns progression over time, or multiple campaigns started at different dates. This enables nice visualizations in Tableau as well.
Of course, many additional indicators can be derived from that data set to help manage marketing investment:
- Cost per Response, per Opportunity, per Deal
- ROI as $ of revenue per $ spent
- Monthly run rates of Responses, influenced Opportunity, influenced Deals
Processing Approach
In order to achieve that output, we will need to bring together the Revenue transactions (Responses, Opportunities) and the Cost Transactions, so that we can perform our calculations. While that looks easy as a one shot exercise on paper, or in Excel, building such logic into a tool like Tableau, that offers so much analytical flexibility, requires some complex data preparation. You can implement intelligent automation in your data preparation processes by using software from Paxata. We will not store any ROI indicator ; they will be computed and displayed on the fly to the user, to enable to pick any combination of campaigns, any timeline, or even any additional breakdown built into the costs and into the revenue, such as region or segment. An additional benefit is that the data set will be easy to refresh, all it takes will be to add new transactions to the revenue or the cost side, to update all the results.
Technically, the ROI challenge is very similar to the approach to display inventory positions. To display the level of a SKU, you do not want to store a level for each day, That would be a lot of data points, mostly redundant, and should you be asked for a position in the morning versus the evening, game over… Instead, you need to store the input and the output with a time stamp and compute on the fly the position.
The technical approach in Tableau is to use Data Blending between data sources, that is to join two TDE Files, one for Revenue and one for Cost. However, there are major limitations to that Data Blending technique in Tableau we need to be aware of and address:
- It requires similar levels of granularity to operate properly: we have to match at the same level, campaign and date. Since not every day has a cost, we will have to perform the match at the month level, and forego analyzing by day and week. This is an acceptable concession in the business context for this ROI analysis.
- It does not support Full Outer Join queries to get all rows from both tables. this is the infamous sparse data issue which will prompt us to ensure that every month when revenue occurs has a cost entry, for every responded campaign. Otherwise, the responses won’t be returned by queries on the cost. This is known as the padding approach, but is simpler using Alteryx than as described by Jonathan Drummey.
Illustration
I will use the scenario described above for Campaign 01 identified as CAMP01 in this resulting Tableau workbook:
Just like what we would find in a source system such as Salesforce.com, we will start with one table of Master data for Campaigns:
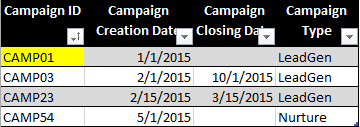 and 4 sets of transactions for:
-
Campaign Costs:
 Those transactions can come from an accounting system and note that not every campaign will have at least one cost for each month: there might be some “holes”, data is sparse.
 -
Responses:
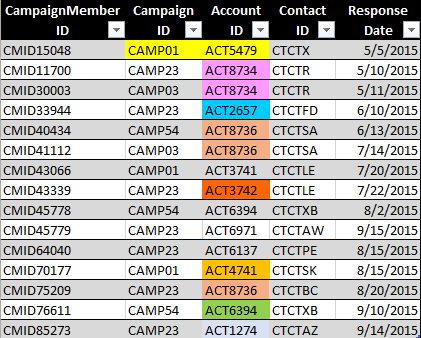 Those responses are usually collected from a marketing automation system such as Marketo, Pardot, Eloqua…
 -
Opportunities:
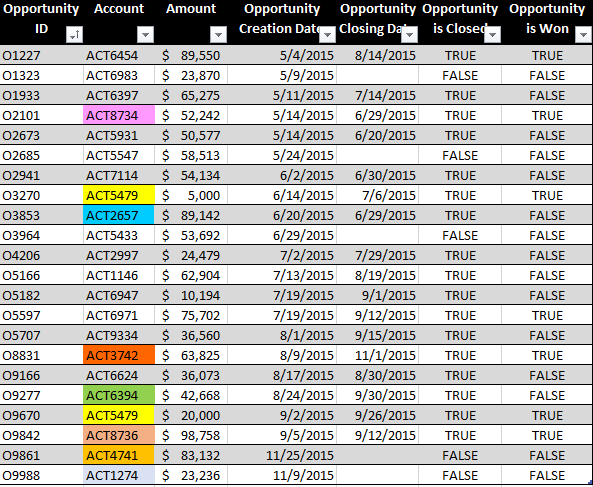 Those are usually collected from a CRM system such as SFDC, Dynamics…
 -
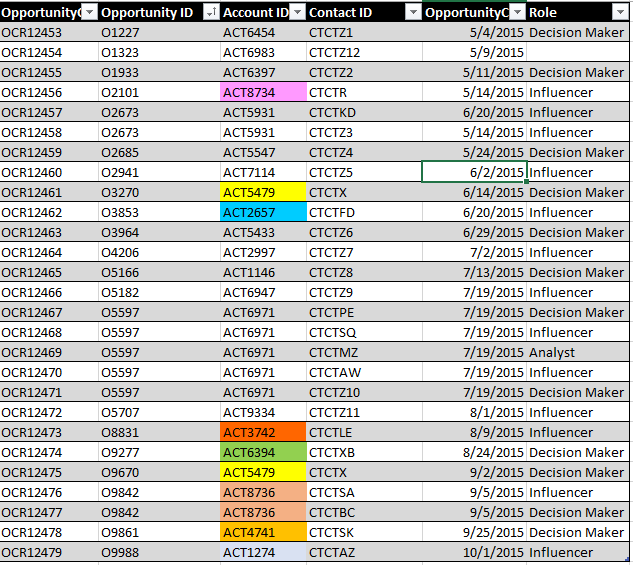
Opportunity Contact Roles:
Next step involves preparing the Revenue side by putting together a Revenue TDE file, blending all those tables:
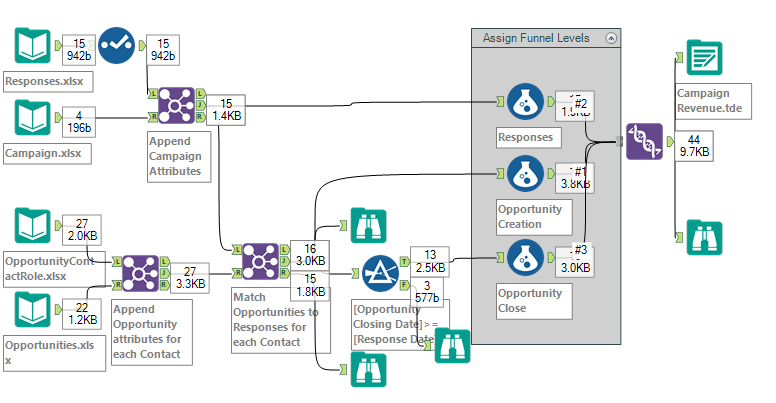 This is a pretty straightforward workflow joining the tables, except for the following:
- Note the filter that ensures that opportunities were created after the response date. We would not want to take into account responses that happened after the opportunity was created, as it is tougher to claim influence
- the Assign Funnel Levels container is routing the transactions into a unique funnel data set:
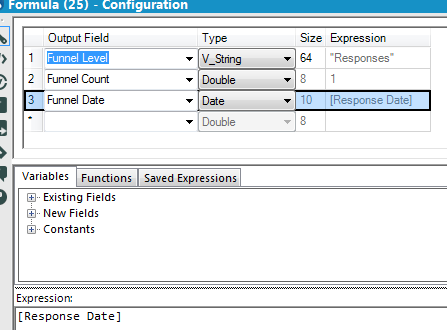
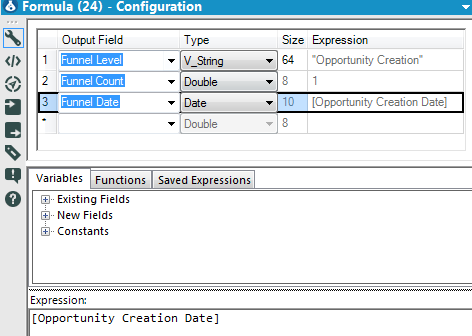
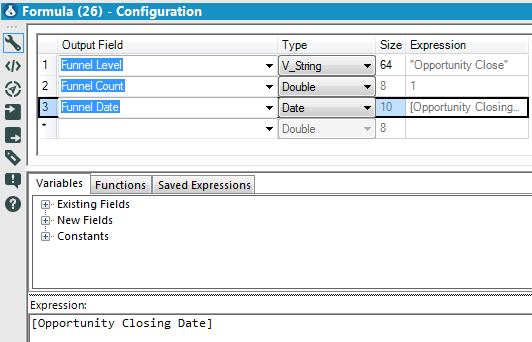
Now that we have the Revenue side covered, let’s assemble the Cost side:
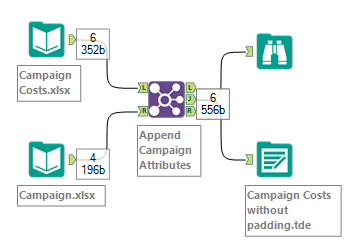 This would be the straightforward approach, but as we saw above, this would create a sparse data set when we blend inside Tableau, so we need to conduct some padding:
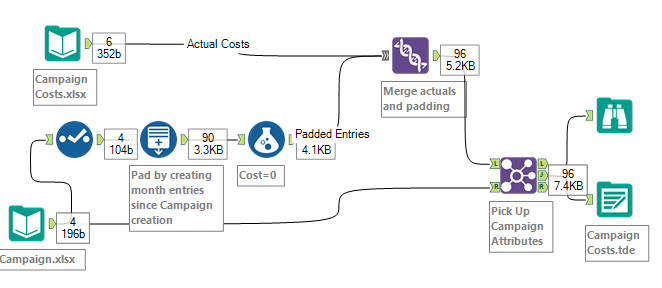 Basically, we use the Generate Row Tool to create padding entries with cost of $0 for every campaign, for every month from their start until the end of 2016:
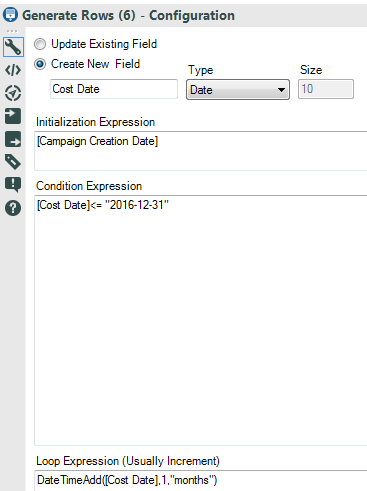 It’s really convenient as it will work automatically and reliably each time a new campaign is created. Here is how the cost table would look like in Tableau WITHOUT padding:
 Notice all those “holes” which would cause Tableau’s data blend to ignore the responses occurring during those months when no cost is recorded? Here is the same data now WITH padding:
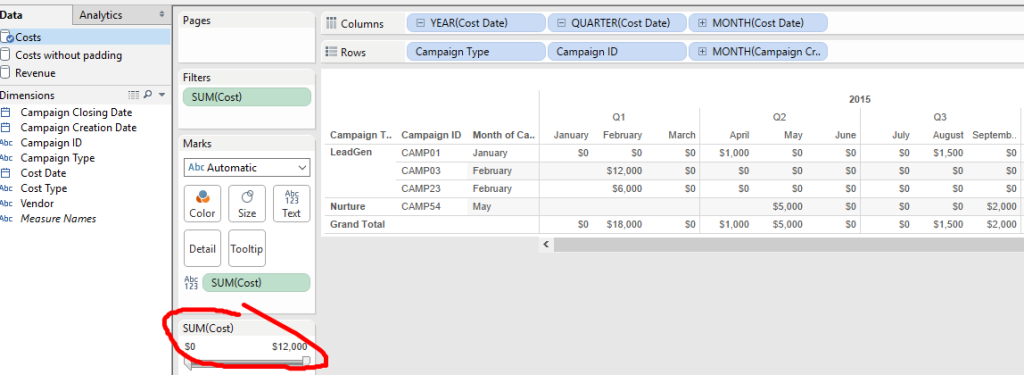 Every relevant month now has a transaction entry, often $0, which won’t skew the ROI. Should it be unpleasant aesthetically or for screen real estate constraints, it is easy to add a filter on cost, as circled above, and set it to $1 and above, to hide from sight those $0 cost padding entries.
Now that our TDEs are ready, let’s blend in Tableau by first setting the relationship between the data sets:
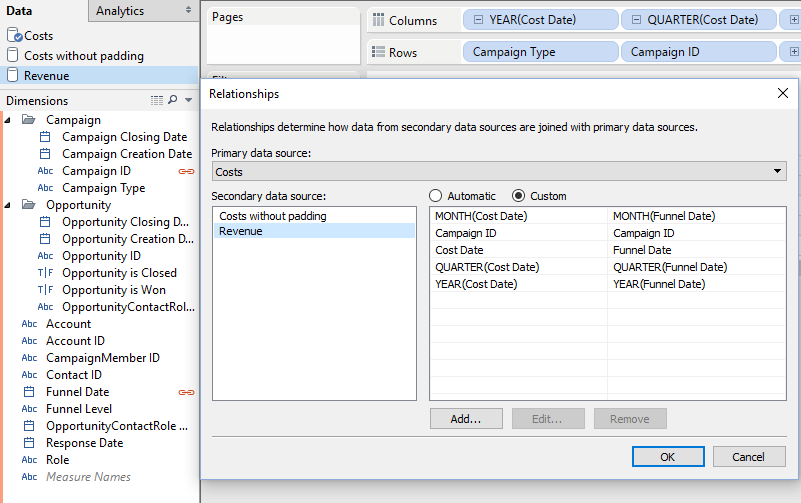 Next step is to create the measures we will need, starting with the revenue side:
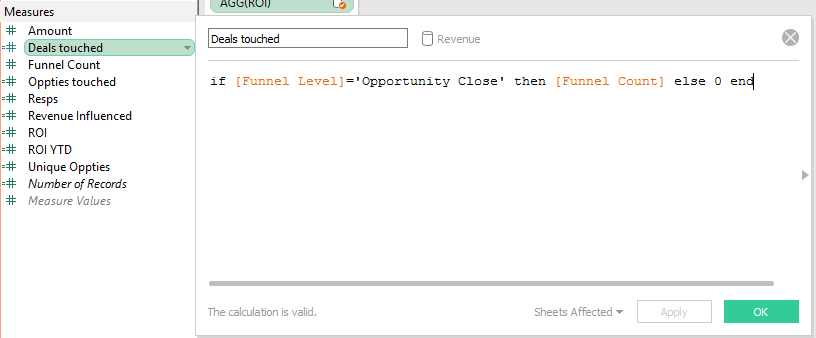 followed by the ROI by time period (Month, Quarter, Year):
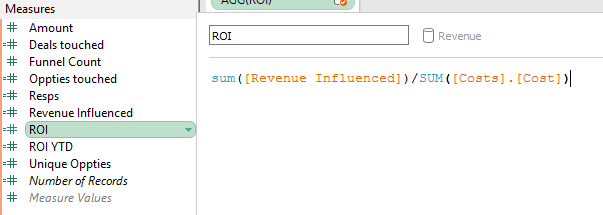 and last, the ROI YTD:
 We can then put together a report to analyze ROI for a month or a Quarter independently of the other periods:
 Here the $1k cost spent in April is not impacting Q3 ROI, whereas in the next, we use a YTD measure with a running sum calc to include all the costs of 2015:
 And we see as expected in the desired Output above, that ROI jumps from 5 in July to 10 in September! QED.
All the files used for illustration (Source Tables in Excel format, Alteryx Workflows and Tableau TDE and TWB) are available to download here: Campaign ROI.

Pingback: How to Calculate Headcount dynamically from Employees Transaction Records | Insights Through Data