Create a delta extractor for MongoDB with Alteryx

Did you get excited by the MongoDB + Tableau announcement about the availability of a BI Connector to extract from MongoDB and convert BSON documents on the fly to the relational format Tableau requires? Then you might have been a bit disappointed, like me, after I found out that the BI Connector requires MongoDB version 3.2, and worse, requires the MongoDB Enteprise Advanced version to operate… This is stated in small font at the bottom of page 8 in that document.

So an easier way to  parse the BSON data stored in MongoDB to a relational format to feed Tableau or most reporting tools, is to use Alteryx, as already explained in that earlier post you can refer to, to get started. If you still feel fuzzy about the reason why MongoDB data format cannot be used by Tableau straight out of the box, MongoDB provides here a great write up that will remind you of the differences between relational databases and MongoDB BSON document format.

One significant enhancement to that earlier post I add, with this post, is delta capability. The goal is to enable automatic extraction of only incremental transactions since the last extract ran. No need to re-extract and re-process the whole year’s worth of data to update only a day!
Continue reading

Posted in Alteryx, Tableau | Tagged , , , , , | Comments Off on Create a delta extractor for MongoDB with Alteryx

Report and Analyze Marketing Campaigns ROI

Marketing ROI is a vast topic, top of mind for most CMOs who feel accountable for their budget. Yet, that topic is not well established academically, and even less technically. A simple search on Amazon shows some books addressing the topic, with very few reviews. Their content comprises mostly frame works: a lot of theories, some formulas and only a few tactics.

In this post, focused on B2B Marketing, I will illustrate how to publish comprehensive data to analyze and empower Marketing stakeholders, based on a simple revenue to cost formula:
Formula
Campaigns’ influence on the revenue (Multi-Touch Attribution) divided by their cost. The goal of this blog post is to roll up the sleeves and present fresh ROI for any marketing campaign, for any month, and aggregate on the fly to Quarter or Year.

This approach has been successfully implemented at Alteryx, and covers the full extent of the Marketing activity, thanks to the processing power of the tools involved: Marketo, SFDC, Alteryx Designer and Tableau.

Continue reading

Posted in Alteryx, Marketing, SFDC, Tableau | Tagged , , | 1 Comment

How to easily Document your Tableau Reports

Every shiny Tableau dashboard comes, or should come, with less glamorous strings attached: documentation… If you want to share the Tableau love, you ought to document how you drove from a data source to a new indicator, and ultimately to an insight. You will find that effort rewarding, even for yourself, should you need to adjust your process months or years after you designed it…

The nice things about modern tools like Tableau and Alteryx is that they make the documenting task way less tedious than it used to be. Let’s review those features briefly and end with a nice tip to document tables for a formal document.
Continue reading

Posted in Alteryx, Excel, Qlik, SFDC, SQL, Tableau | Tagged , | 1 Comment

TC15 Tableau Conference Highlights

This year’s Tableau Conference in Las Vegas was a good vintage, it was large and crowded for sure, but loaded with good content and some spectacular product announcements.

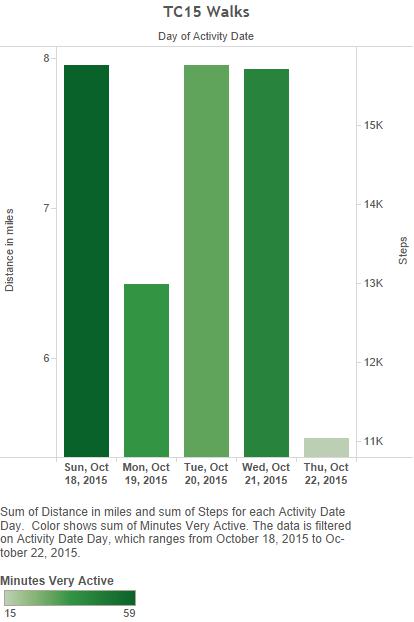
With 11,000 attendees, the 2015 edition almost doubled the size of Seattle’s 2014. It was great to run into prominent members of the Tableau community such as God himself Joe Mako, but also Ken Black, the Ace team from Information Lab, or John Mathis. On the flip side, I barely got a chance to engage them as the crowd flows was carrying us apart. The sheer size of the event also meant a lot of walking, as my Fitbit data can testify in this following Tableau viz, using Craig‘s handy Web Connector:

fitbit TC15

Yes, that’s 36 miles in 5 days, not too shabby without sneakers…
Continue reading

Posted in Tableau | Tagged | 2 Comments

Using the new REST API Marketo Connector in Alteryx

“Why would I need to use a Marketo connector in the first place? The reports, called Smart Lists I can whip together in Marketo in a matter of seconds should be good enough? They handle large volumes of transactions pretty well, don’t they?”

Some businesses find Marketo very helpful to grow. Others use Marketo to Microsoft Dynamics CRM integration to help boost their business practices. And a few businesses won’t find Marketo helpful at all. It’s hard to know where you stand until you give it a go so I’ll respond to those objections that lists have a very limited purpose for business. They are more of an operational nature. They won’t serve well the need of tracking trends over time, which requires more altitude. Trend views should display aggregates, which do require transaction level data underneath. Hence the need to extract those transactions from Marketo, cleanse and assemble in Alteryx, and serve in aggregates in Tableau for analysis.

Should you still be not sold on the necessity to extract Marketo transaction to a data warehouse, just try to build a report in Marketo showing counts of unique activities, instead of a count of leads who performed the said activities. I haven’t found a way yet… Let’s take a simple example: it’s planning season and you need to set new targets, and obviously you need to establish a baseline from past performance. You might get asked something as simple as:
how many web forms were filled last year?
Marketo will reduce this inquiry to:
How many unique (to the best of Marketo’s knowledge) leads have filled a form last year?
It gets worse if you consider the issue of leads with multiple activities, which is not a far fetched scenario: a lead might visit your website more than once, at least I hope so, for the sake of your business… Let’s illustrate with Lead XYZ who filled out a form in February, one in March and one in June. Well, a Marketo report against the Lead database will give you different counts according to the time slice you select: 1 form filled for the Year, 2 if you break it down by Quarter (1 for Q1, 1 for Q2) and 3 if you break it down by Month!
To avoid those issues, you need to extract activities at the transaction level, and THEN tie them to their lead record, outside of Marketo…

With the newly released Alteryx V10, comes an eagerly expected new version of the Marketo Connector. The now deprecated earlier version of the connector was based on Marketo’s SOAP API. In the context of Marketing analytics, that connector worked, but too slowly to handle data volume, as a SOAP API is designed for a more transactional purpose, imposing rate limits of 100 API calls in a 20 second window. Any live Marketo instance’s daily volume of transaction will easily break those limits, which is why api testing is also vital in these kinds of circumstances.

The version of the connector delivered with Alteryx V10 is based on Marketo’s REST API, widely more adequate for manipulating volumes of transactions. Here is a handy guide to help your Marketo Admin generate connection credentials you will need, to use the connector.

Now Marketo’s REST API is not perfect, yet. The most glaring limitation is that it does not feature (yet?) a DateTo field to select transactions. This creates head scratchers for anyone who needs to refresh data sets in their data warehouse without reloading the whole history. Especially since Marketo is restricting contractually the number of API calls you can make against their API, and will charge you accordingly. I will hopefully contribute to alleviate that issue demonstrating how it can be done with an Alteryx workflow or an ETL.
Continue reading

Posted in Alteryx, Marketing, Marketo | Tagged , , | 9 Comments