This post is an extension of the previously covered topic:
Display optional business Targets to your Actuals in Tableau
The business scenario used to introduce the topic in the previous post was kept basic, on purpose. I’d like to introduce a scenario a bit more realistic, which would involve more complex and tedious calculations.
Using the reliable SuperStore data set, let’s say that we are preparing to monitor 2012 sales. Instead of applying a uniform growth rate to every sale by category, leadership requires a growth rate that will depend on the forecast growth rate of each US State, that one can imagine has been provided by research analysts. Furthermore, leadership wants those targets broken down by product category, and wants to track at a minimum the performance Year To Date, and at a maximum per week level of detail. We know that working by week requires to input those targets at a daily (=date) level, so that the targets can be compared to either weekly aggregates or Monthly/Quarterly/Annual aggregates, since the day is the only common level of detail between Week and Month (there is almost no clean 4 weeks month in the calendar).

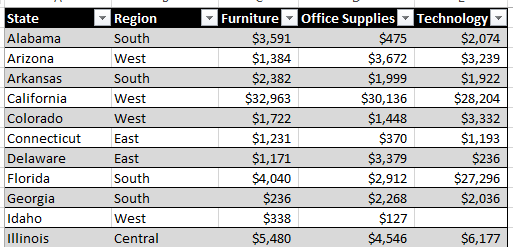
Actuals from 2011 by Category
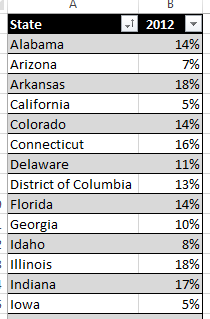
Target Growth Rate by State for 2012
With those inputs, you need to be able to track YTD progress by week, month, quarter, half and year… Alteryx to the rescue!
Continue reading →
 If you are reading this post, you necessarily belong to one of those categories:


