This post is an extension of the previously covered topic:
Display optional business Targets to your Actuals in Tableau
The business scenario used to introduce the topic in the previous post was kept basic, on purpose. I’d like to introduce a scenario a bit more realistic, which would involve more complex and tedious calculations.
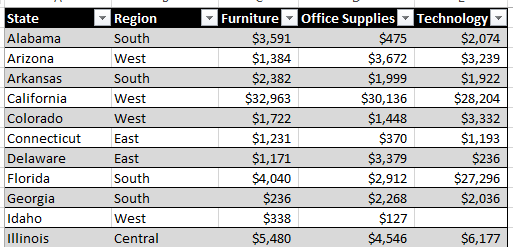
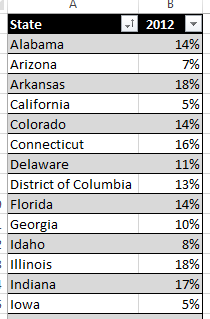
Using the reliable SuperStore data set, let’s say that we are preparing to monitor 2012 sales. Instead of applying a uniform growth rate to every sale by category, leadership requires a growth rate that will depend on the forecast growth rate of each US State, that one can imagine has been provided by research analysts. Furthermore, leadership wants those targets broken down by product category, and wants to track at a minimum the performance Year To Date, and at a maximum per week level of detail. We know that working by week requires to input those targets at a daily (=date) level, so that the targets can be compared to either weekly aggregates or Monthly/Quarterly/Annual aggregates, since the day is the only common level of detail between Week and Month (there is almost no clean 4 weeks month in the calendar).

Actuals from 2011 by Category
Target Growth Rate by State for 2012
With those inputs, you need to be able to track YTD progress by week, month, quarter, half and year… Alteryx to the rescue!
Excel is a great tool to let you input data in a layout you like, but not so good to transform data, especially for repetitive tasks. The approach we are taking here is to stick with the initial target spreadsheet as much as possible, so that it is easy to edit if needed. We will have Alteryx perform the grunt work, in 5 seconds, turning the spreadsheet into a format of daily transactions suitable for Tableau to ingest:

- Start by transposing those product categories into additional rows, turning 44 rows *3 categories into 132 rows
- Then use a Join to assign a growth rate for the State of each row, using the growth targets spreadsheet. Still 132 rows.
- Use the Formula tool to Apply the growth to each sale figure and create a new column to stamp the data as a Target Version. Still at 132 rows.
- Use the Generate Rows tool to expand each row with an annual target into one row per Day, therefore date. Note that 2012 is bissextile, but the tool will work nevertheless since it is using a date function to fill from Jan 1 to Dec 31. We get now to 132 rows *366 days = 48,312 rows
- Convert the annual target amount found on each row to a daily by dividing each row by the calculated number of days in the year. This is done in a couple of click using a Multi-Field Formula tool
- Finally blend the Target Version with the Actuals using the Union tool. The idea is that the Actuals can be refreshed as needed. We add 9,994 rows of Actuals to the 48,312 to obtain a final 58,306 rows
When manipulating such volume of rows, expanding from 44 rows initially to 48k, you should feel happy you are treading away from Excel. Indeed, unlike Excel, Alteryx is not limited to 1M rows. With the TDE generated, and the instructions of the previous post listed above, it becomes super easy to generate a view like that one:
Note that various levels of aggregation are now available: by Category, by State, by Region, by Week, Month, Quarter and all the permutations…
The workflow and source spreadsheet are available to download here.

Pingback: Display optional business Targets to your Actuals in Tableau | Insights Through Data
Pure sweetness. I like the approach you used to describe the workflow. I also love the hyperlinks to the tool descriptions. I was going to do that in some of my articles but I was too lazy to do it. Congrats – you keep making these articles better and better.
Pingback: Overcome 10 Excel limitations with Alteryx | Insights Through Data