
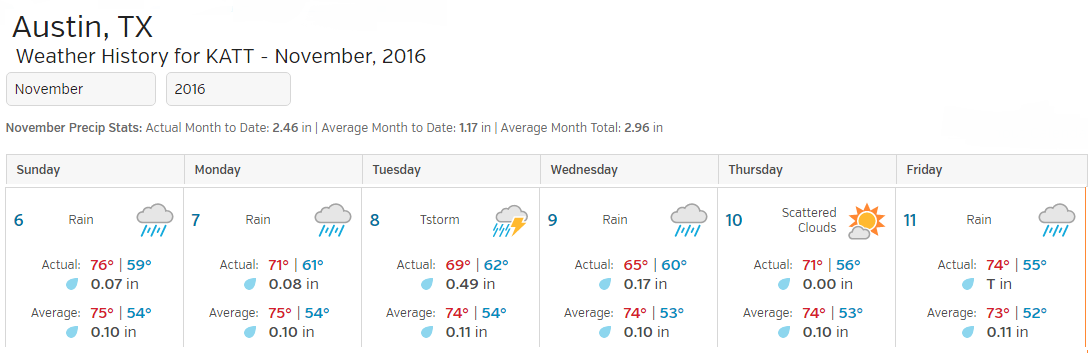
This year’s conference took place in Austin, TX. Yet, our Tableau friends must have felt right at home, as if in Seattle. The constant drizzle and low ceiling were certainly more reminiscent of a Pacific Northwest scenery. It took until Thursday at noon, tail end of the event, to catch a glimpse of sun:
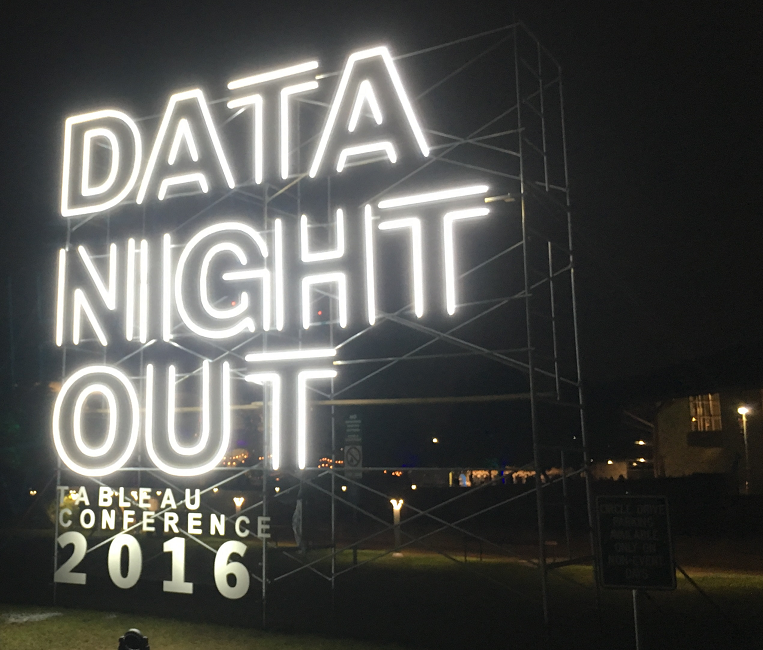
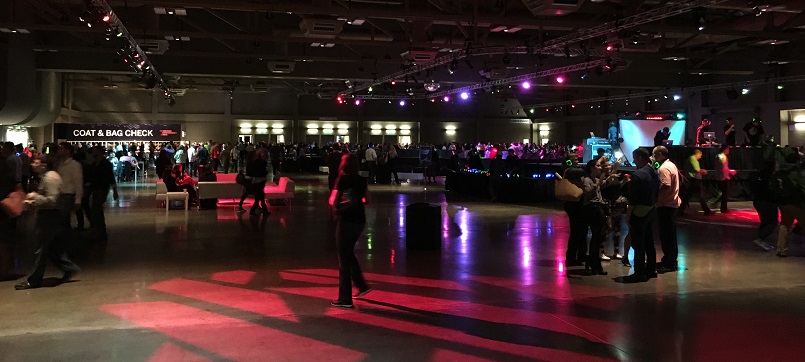
Good thing organizers had not planned the Data Night Out party to take place fully outdoors! It featured a large indoor area at the Palmer Events Center, with a roller skating ring, among the variety of fun attractions:

Just like the previous years, there was a lot of walking involved throughout the event, 35 miles in 4 days in my case, between the Austin Conference Center and surrounding hotels. Despite the 13,000 attendees, 9,000 of which were first time attendees, it felt way less overcrowded than the 10,000 of TC15 in Vegas, kudos to the organizers!
Note that this year, Domo, a Tableau competitor, made quite a splash, by actively trolling the conference. Standing at the edges of the Convention Center perimeter, they attempted to lure attendees towards their own events, with what must amount to quite a budget:

Big parties every night with Flo Rida or Snoop Dog, open bar, bar crawls… I can’t quite see in their approach a good match with the affinities of TC attendees, comprised mostly of analysts, not exactly on the bro side of things… On the less entertaining side, the message to Tableau customers, carried by many Domo employees, comprised this type of arguments:
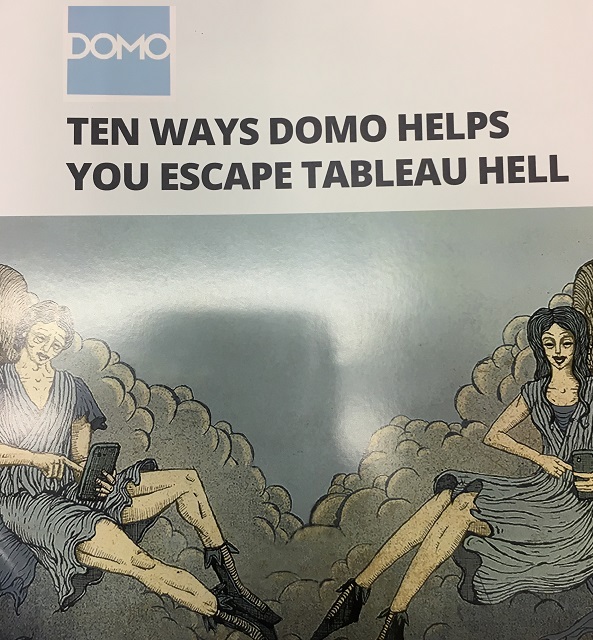
Half of the 10 talking points conveniently omitted the existence of Tableau Online. The other half was banging on missing features, which actually got announced during the keynote, as listed further down this post… I don’t know what type of results this trolling campaign led to, all I can say is that it was not compelling to me. But hey, Domo earned a mention on my blog, this has to count for something!
Back to this year’s program, the main Keynote event as well as Devs on Stage were choke full of announcements this year, and are well worth your time watching, if you use Tableau. Here are the announcements that stood out for me:
Major enhancements:
- Hyper engine: First announcement I am aware of, since the acquisition last March, of the secretive Hyper DB technology. Integration of the technologies seems to proceed smoothly, if I can judge by the demo: Tableau handled smoothly a data set of 4 billion rows, even while updating in the background. The first publicly available beta was announced for early 2017. “It’s designed to simultaneously process transactional and analytical queries without compromising performance”. I feel frustrated, though, by the total lack of explanation, as to what enables that quantum leap in performance…
- Project Maestro: Talking about skunk works, Tableau revealed a new product, code named Maestro, ” for self-service data prep, enhanced governance controls, instant analytics, and much more”. The demo was so quick, it was hard to form an opinion, even though it seemed pretty polished already. Again, no mention was made that that is a standalone product, not included with the Tableau desktop nor server license. Quite an omission… That revelation could have tempered some of the enthusiasm seen in the audience, taken by the demo. In any case, it is interesting to see Tableau formally admitting, for the first time, the need for a data prep tool, validating the relevance of Alteryx and other players in that field.
- Dynamic Time Selection: a very welcome enhancement to the viz user experience. Users will be able to select, on the fly, a time frame in the viz, and see displayed relevant indicators for that selection. Will really provide an edge over spreadsheet!
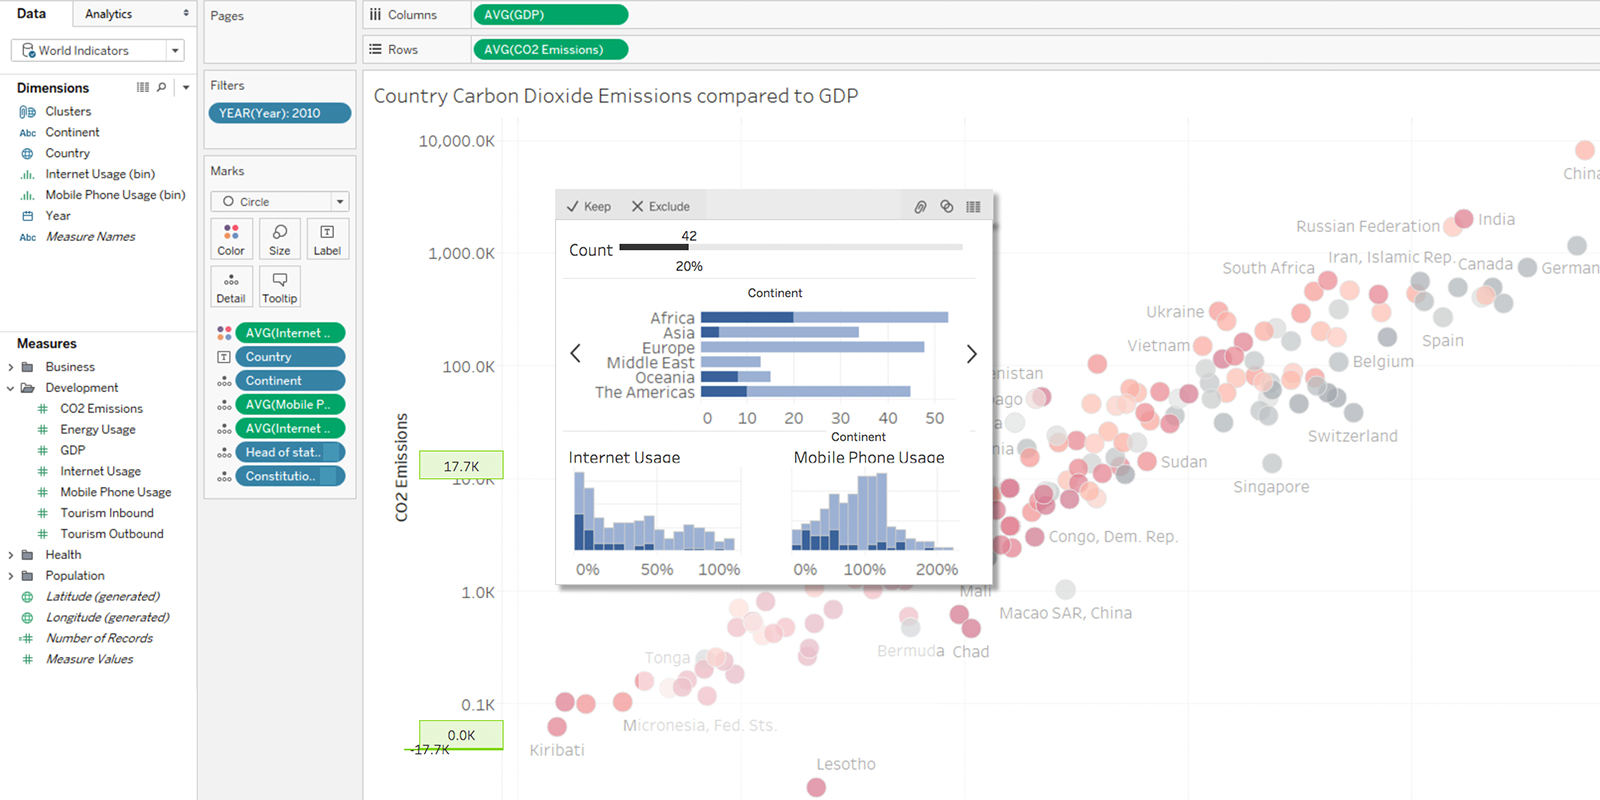
- Dynamic Tool Tips and drill down: Another major enhancement for the viz user, which got me really excited too. The Tool Tip becomes a real extension of the analysis, able to display another viz, or enabling a drill down into any of the dimensions displayed. It is hard to describe, but well worth a look at the demo. Some of those features were disclosed during the keynote, some during Devs on stage… Here is a shot from the demo:
- Natural language queries: Pretty compelling demo that shows how Tableau could respond to natural language questions. I have seen this feature presented by Microsoft some time ago though… Is it leveraging their API?
Welcome tweaks:
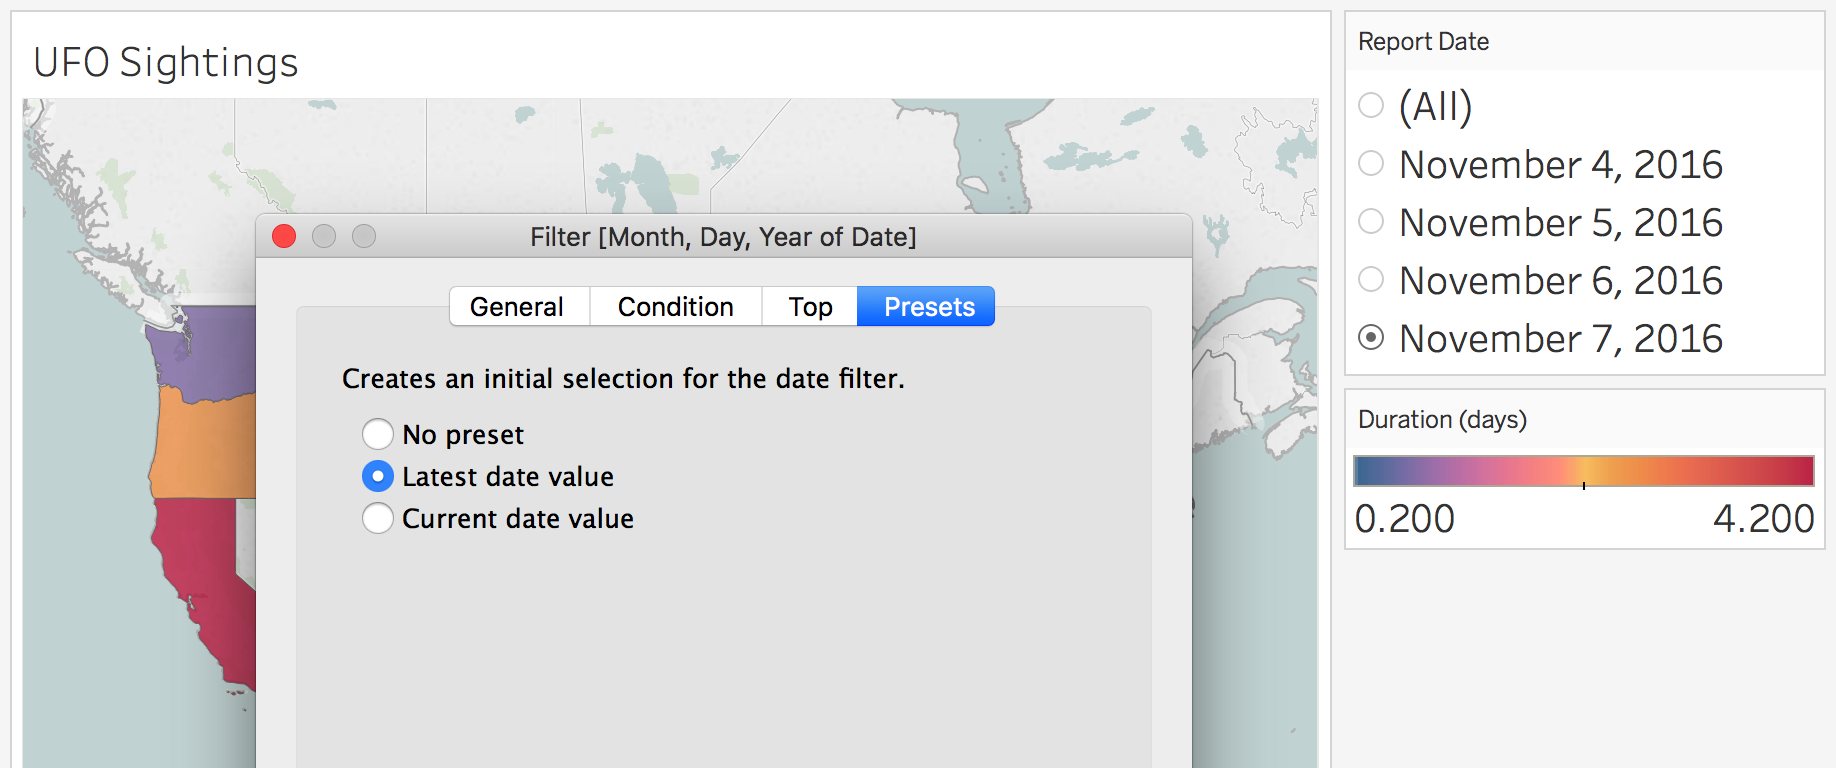
- Latest date filter preset: Finally an option baked in, to automatically select the latest date in a filter!! No more hacking that one!
- Series alignment on time or index: automatically recalculate multiple series, on the same index or time frame, nice productivity tweak, really!
- PDF Connector: A really cool feature, if not major. PDF will now be accepted as data source by Desktop, which will parse through the data contained, mostly automatically. Again, it would have been nice if Tableau had acknowledged that it won’t work on all PDFs. I am thinking of those comprised of scanned documents, which happen to be the most commonly found, sadly…
Overdue features, to catch up on competition:
- Trigger Alerts + Conversations: I can imagine the relief felt by most Tableau account managers when they found out, that finally Tableau would offer trigger based notifications and more dynamic conversations, both standard features of cloud platforms, such as Domo (see higher in the post)… The UI seems well thought out and easy to use, even for the less data inclined user.
- Dashboard layout assistance: The most acclaimed features of all, which might finally reconcile me with Tableau dashboards. A functionality will offer to assist properly align the elements of a dashboard, just like in PowerPoint. Some others will let the designer add margins here and there, for a much cleaner output. Productivity! No more hair pulling! In the audience, tears of relief were rolling along the cheeks…
- Direct integration with Python: Account managers for academic accounts must jump off their seat with delight…
- Tableau server on Linux: nice one to make peace with customers’ IT departments
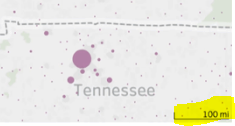
- Map scale: One of the most requested feature by Tableau developers for 4 years, and rightly so:
 Never too late:
Sadly, still no love for Sankey in Show Me… Gonna have to stick with the nice how to guide by Chris Love…
Besides those sessions dedicated to announcements, without much milestones dates, there were over 500 sessions to attend and learn from, either from the experience of other customers, or hands on with Tableau staff. Here are those I attended:
- Order of Operations for smarter analytics: I was feeling a bit rusty, dealing sometimes with conflicting Table Calcs and LODs. That session was a nicely put together hands on refresher. This is a must know topic for those willing to grow their skills beyond the Tableau wall.
- Structured vs. semi-structured data analysis with JSON: Surprisingly, it was the one and only session on the topic. Low interest in No SQL? They offer such challenges to Tableau reports, and required so far Alteryx to access, nice inroads were presented…
- Hands-On Jedi Showdown: That one has no replay video. It was great fun, some type of time challenge among all participants, who had to solve pretty complex challenges, using Table Calcs priorities tricks and LODs formulae… The questions were way harder than the certification exam, and the competitive atmosphere was pushing the difficulty further…
- Writing your first Web Data Connector: That one was a bit of a letdown…. Was hoping for some more hands on approach, but it had nothing that spending 5 minutes in the documentation would not teach…
- Stop your Calcs from bugging out: Some brush off of formulae, how to deal with aggregates, complex logical statements and best practices. Not earth shattering, but hands on with some useful tips…
- Best Practices for using AWS Redshift and Tableau: a VERY technical session, but choke full of advice and real life experience to improve performance. An invaluable reference for anyone dealing with Redshift.
- Zen Master – Jedi Charts: presented by the impressive Chris DeMartini and Adam McCann, some really eye opening walk through of Tableau graphical abilities, pushed way beyond the envelope… Among other things, how to draw a KPI gauge, which is custom code since Tableau frowns upon gauges… Clear, sharp, and compelling session…
- Making Magic with Multiple Marks: another hands on session, which I found underwhelming, a bit too simple…
- Zen Master – Sealed with a KISS: Presented by the always great Chris Love, his well documented case for using simple vizzes over complex and fancy displays of technical skills. Talking from experience, huh?
Here are some additional sessions I didn’t have a chance to attend but will watch post event:
- Interactive Forecasting at Visa: I heard great feedback from fellow attendees, how Visa is pushing the envelope on forecast calcs, beyond the standard feature.
- Building a bridge between IT and Business: who doesn’t relate to that problem?
- Data-driven alerts come to Tableau: Not a moment too soon! Curious about the details…
- Tableausaurus Regex Unleashed, The power of Tableau Regular Expressions: Any training on Regex helps!
- Advanced Mark Types: The more I use the V10, the more I find there has been quite a few tweaks to the Marks, very subtle. Good catch up session
- Becoming Data Storytellers through the Reviz project: I had every intention to attend that one, but the room was already fully packed 15 minutes before start. Since it was presented only once, quite a missed estimate of interest…
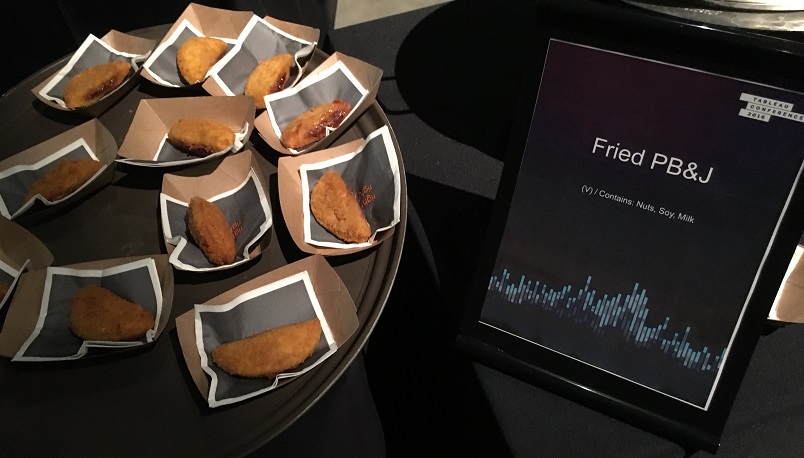
Overall, this remains a fun event, well run, with tons of educational value, well worth the investment of time and expense… And where else could you sample such variety of Texas “delicacies”?
Pingback: #Data16 Presentation: Fun or Serious? How to use both to improve your dashboards – VizPainter
Nice summary Frederick
Pingback: Unboxing Tableau Prep 2018.1 | Insights Through Data
Pingback: TC18 Tableau Conference Highlights | Insights Through Data