
When it comes to businesses, there are many ways that they can be successful. For example, some businesses like to use things like a microsoft dynamics implementation to help them when it comes to CRM (and also ERP). ERP and CRM tend to not only help users streamline the business by improving their workflow but also helps increase efficiency by storing all the data in one unique database! If you would like to know more about the same, you could always visit Syte Consulting Group for a consultation or maybe visit their website to know more about the work done by them.
That said, this isn’t the only thing that they can do. If you are a business owner, then you might have heard of Business Intelligence solutions. One key benefit of Business Intelligence solutions is to let users gain what I call data altitude. Namely, they can see large volumes of transactions in ways that are, hopefully, business relevant.
Taking specifically the example of salesforce.com’s CRM solution, or SFDC for short. Users will often look at a specific record directly in SFDC, with a wealth of details on, say, a prospect, a campaign or an account. If they want to take a look at a group of accounts, they can look at a SFDC report, which will pull literally a list of those accounts, with a handful of relevant attributes. This can also be maintained and automated with software that has been tested by Parasoft systems for extra efficiency.
But frankly, that’s a fairly low altitude. Altitude requires real aggregates, such as buckets of accounts that fall into such and such category for instance, which is great for segmenting. For that purpose, Tableau offers a much better experience than SFDC. Salesforce Wave, an add on to the core CRM product, is intended to bridge that gap, but it lacks in maturity and is very costly in my opinion.
Presenting SFDC aggregates in Tableau is therefore a great idea, and is already widely done. It is such a common scenario for Tableau owners that Tableau comes with a native SFDC connector. Internally, Tableau the company presents SFDC data through Tableau the product. Note that they are not using their native connector, but rather a 3rd party OLE DB connector, as explained in this great description of their internal dog food approach.
One challenge with displaying aggregates as summaries, is that users feel sometimes legitimately dubious about data quality. They might come across these aggregates for the first time, especially during user testing or user acceptance phases. The standard Tableau approach of displaying underlying data works great as a quick & dirty solution for the most advanced users, but still takes too much efforts, and falls short for the casual user. Here is a refresher nevertheless, in case you are not aware of that built in feature:
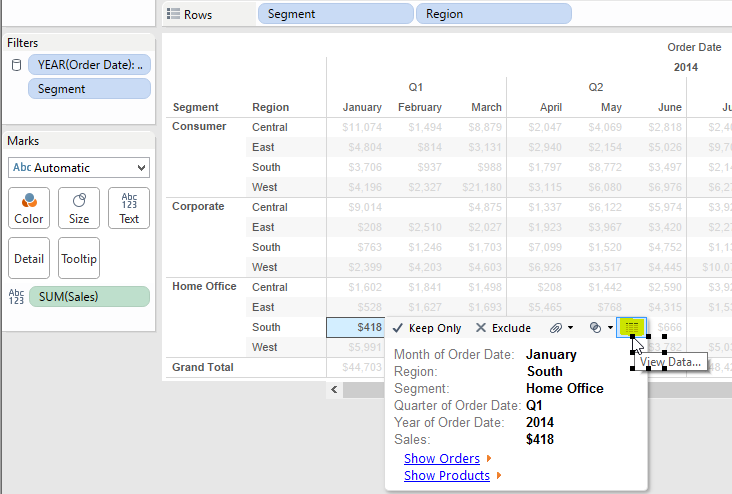
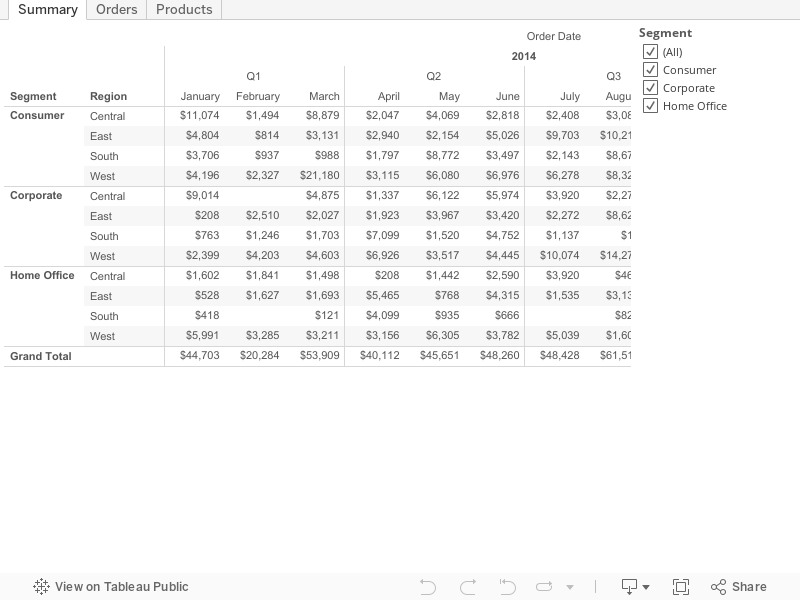
- I am using the Superstore sample data for this example, where I summarize order transactions into Regional Sales by Segment for 2014. In my scenario, I question the $418 January Sales for Home Office in the South Region. I first need to select that cell and upon clicking, a menu appears on top with a very small View Data icon:
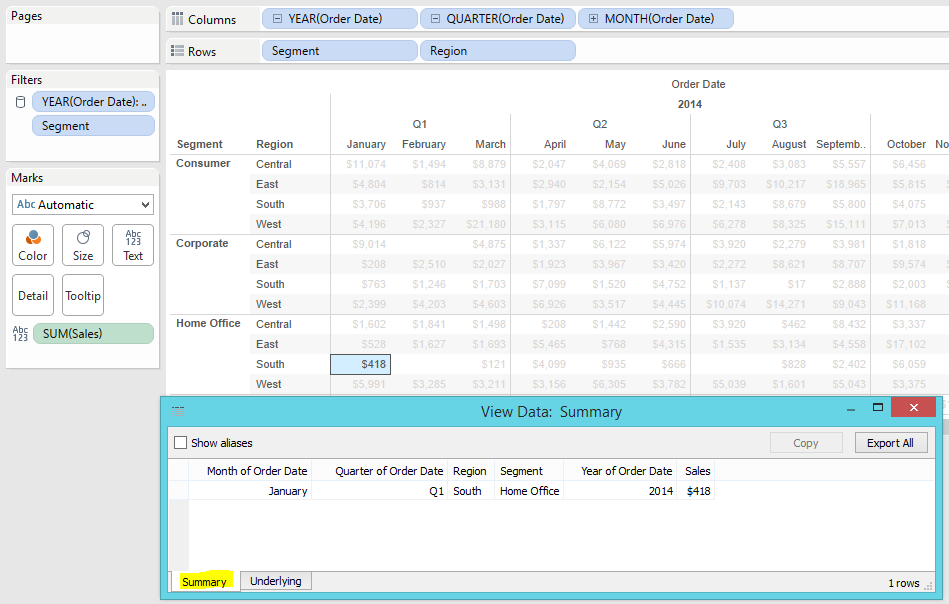
- a new window pops up, it can be behind the current browser window when using Tableau Server, which shows the same data but as a flat line:
- Now to see zoom into the transactions, I can click the Underlying tab:
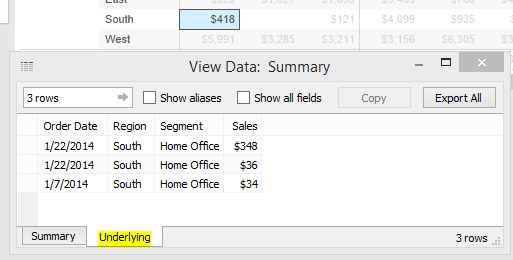
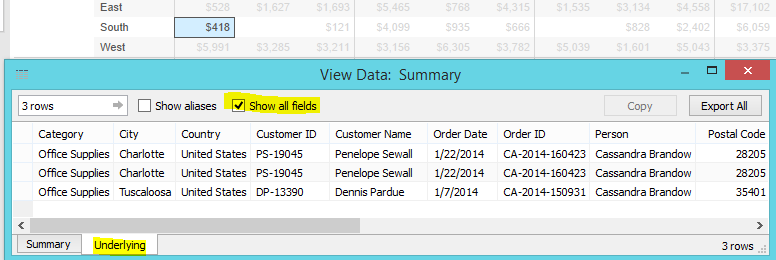
to verify that $348+$36+$34=$418. Yet, what are these lines corresponding to? Which orders? - To get to the full transaction, I can click on Show All field to get all the details of the transactions I imported from my Sales Order system:
 Should the list become too long to analyze, I have the option to click on Export All, to generate a CSV file which can be read by Excel or pretty much any BI tool.
This feature of Tableau is really useful, especially for random audits that don’t require to plan the drill down path. Yet, it is a bit technical, and still restricts the final level of details to whatever was pulled from the source system.
Tableau dog food blog post inspired me to replicate the enhanced user experience they came up with: Provide an Audit trail to the user, or as Tableau puts it: “details-on-demand”. It is a great opportunity to get acquainted with another very useful feature of Tableau: Actions. The concept is to enable the user to jump from a summary to the highest level of details directly in the source system, with the limitation that it must be cloud hosted. With the same data set and scenario than above, namely investigating summaries of Superstore orders, here is how it would play out:
- Just like above, I start by I selecting the cell to question the $418 January Sales for Home Office in the South Region. Yet, this time, instead of selecting the View Data icon, I click on the Show Orders Hyperlink:
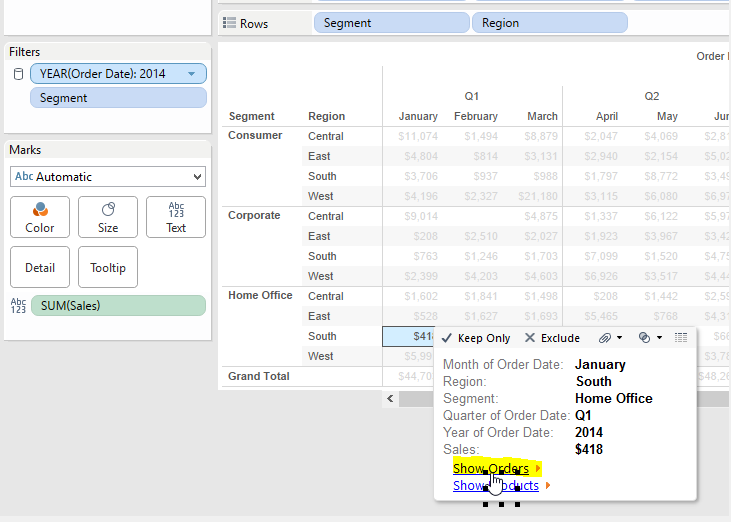
- Tableau takes me to another reports that lists the details of the Orders most relevant to my analysis, including a nice total that confirms these are the orders amounting to $418, I am interested in:
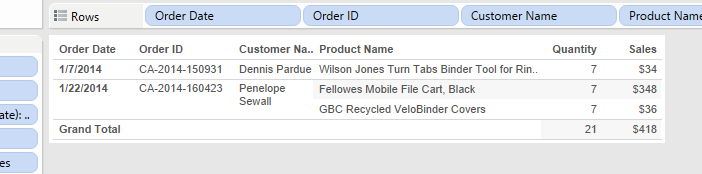
- I find the order by Dennis Pardue surprising, wouldn’t it be nice to be able to jump to my Sales Order system to see all the details pertaining to that order? For the purpose of that demo, I don’t have a cloud ERP to offer you to jump to, so instead, I tweak the scenario to investigate who’s Dennis Pardue:
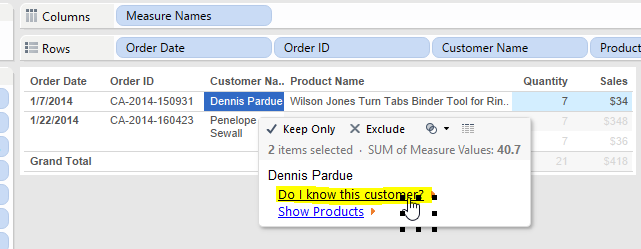 Do I know him? Let’s click on the hyperlink to find out
 - It turns out Dennis is not part of my LinkedIn network:
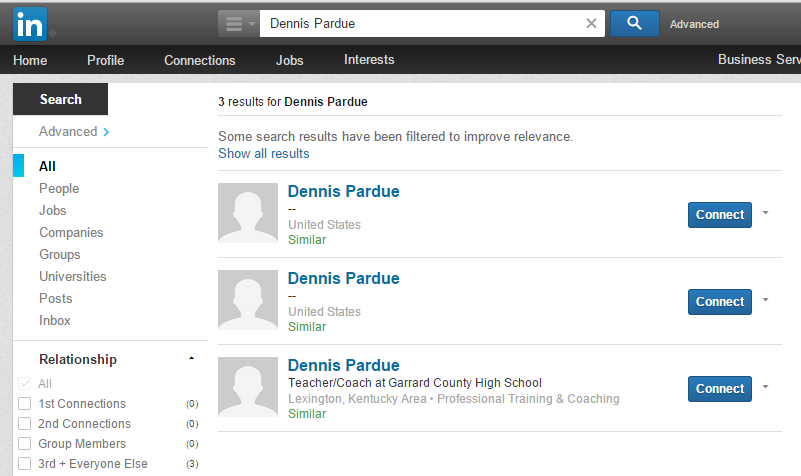
This scenario illustrates how I can display summaries and jump to a website while passing parameters, in that case just a simple name, but it could be way more complex, out of the box. See for yourself the demo in Tableau:
Here are the steps I took to build:
- Build the reports I need for the jumps, following a path defined in the scenario. In this case, a Summary of Orders, a drill down into orders details, as well as another into Products details
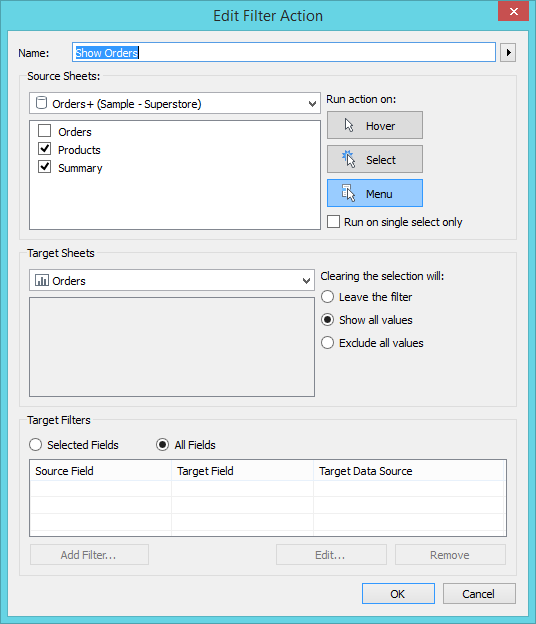
- Go to Menu Worksheet/Actions, click Add Action, select Filter type, and use these parameters:
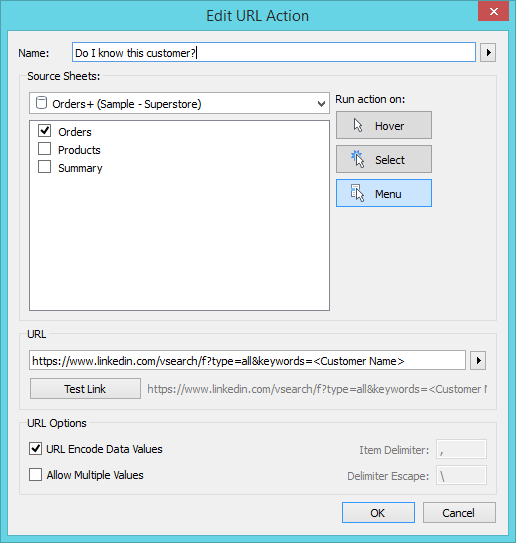
- Create a second Action to jump from a Customer Name to a LinkedIn query, this time using a URL type:
That’s all there is to it!
Of course, it requires to know which paths the users are likely to take, but then, knowing the user is a prerequisite to work on the user experience…
To specifically jump to SFDC, there are two URLs to know:
- Jump directly to the record:
https://www.salesforce.com/ - Search for any objects using a string as input, such as a name or an email address:
https://www.salesforce.com/_ui/search/ui/UnifiedSearchResults?searchType=2&sen=00O&sen=005&sen=006&sen=701&sen=00Q&sen=001&sen=003&str=
Hi,
I am not able to see “Underlying” option when we click any cell in report and click on view data in tableau desktop
Instaed of “Underlying” option, I can see “Full Data” option.
Can you please help me how to get the “Underlying” option in tableau desktop.
Since the blog post was written, Tableau has renamed the tab from “Underlying” to “Full Data”. Functionalities are the same though…