
When reporting on any type of business performance indicators, it is very useful to compare the actuals to some targets, to visualize attainment. This can be a challenging endeavor in Tableau, as the model offers many different way to aggregate and present data.
Using Superstore sample Data Source, Let’s implement the following business scenario: during the Year 2014 planning exercise, it is decided that 2014 sales should increase uniformly by 80% over 2013 sales, and therefore we want to display the 2014 Actuals performance against this 2014 Plan/Target of 2013 sales * 1.8.
This post shows how to put together a Tableau workbook with an optional display of targets as per below:
Try the On/Off switch for target display and note that selecting a Quarter displays quarter results
One could argue that for such a simple scenario, we would be better off using table calcs in Tableau, just like it is done in this forecast example. I agree, but today, I will use Alteryx to prepare the data and blend the target values within the Data Source. This will ensure best performance in Tableau, as there is less calculation to perform at each navigation step, and no kludgy Tableau data blending to configure either between the Actual/Plan and Target Data Sources. It is way more comfortable to operate with a single Data Source.
As additional benefits come, Alteryx can serve way more complex business scenarios. For instance, we could modulate the 2014 growth forecast by:
- Customer type
- Product Type
- Month, Week
- Even use R predictive models to get better targets.
If the Targets are defined at a higher level of granularity than the Ship Date, which is to be expected, simply divide the annual total per 365, to be able to aggregate your targets by any Ship Date grouping such as Week or Month.
In this case, I used a simple logic in the Alteryx workflow available here:
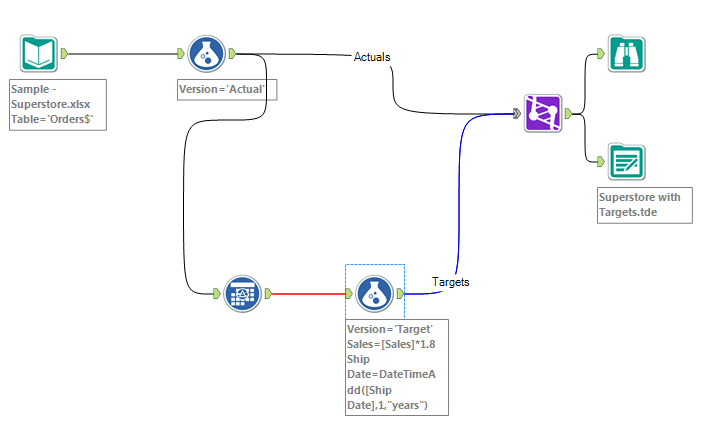
- Load Superstore Order sheet
- Create a Version Column and tag Actual transactions
- Copy 2013 transactions using a date filter on Ship Date, tag those transactions as Target, multiply their sale amount by 1.8, and add 1 year to their ship date using the DateTimeAdd() Alteryx function
- Use Union tool to merge the Actual and Target sets of transactions
- Generate a Tableau friendly TDE file
The Tableau part becomes a bit trickier:
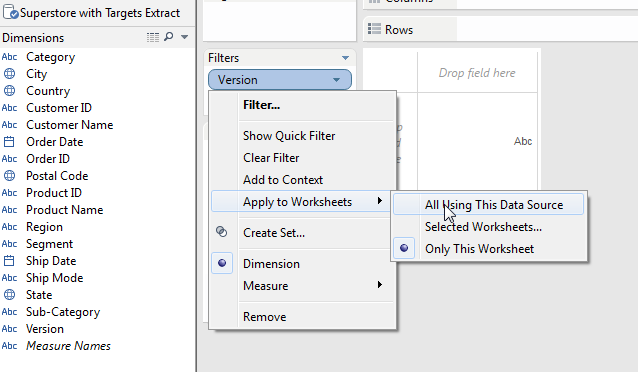
- Drag new Version field into filters and set to be used in all views using the Data Source:
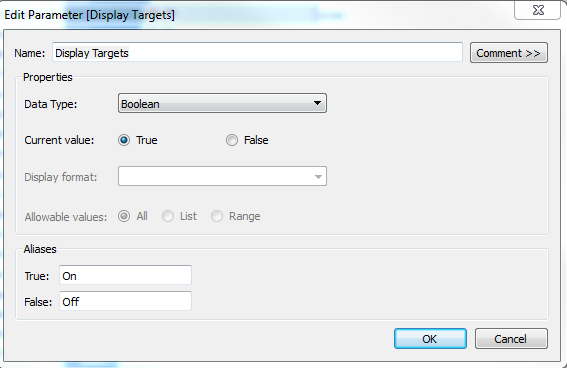
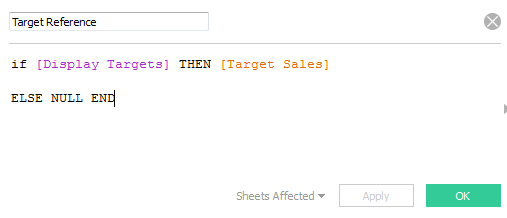
- Create a “Display Targets” parameter and add it to the sheet:
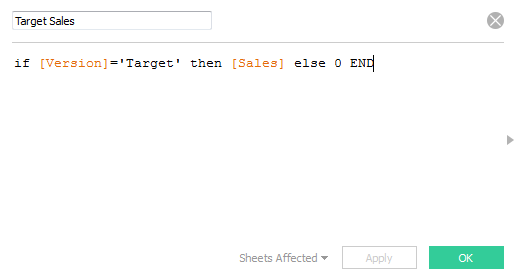
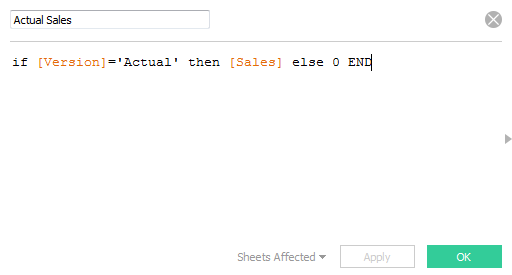
- Create Actual, Target Sales and Target Reference Measures:
- Drag Sum of Actual Sales to Columns, Product Names to Rows and Sort them
- Drag Ship Date to Filter and select Year 2014
- Drag Sum of Target Reference to the Detail Mark
- Right Click Actual Sales Axis and Add Reference:
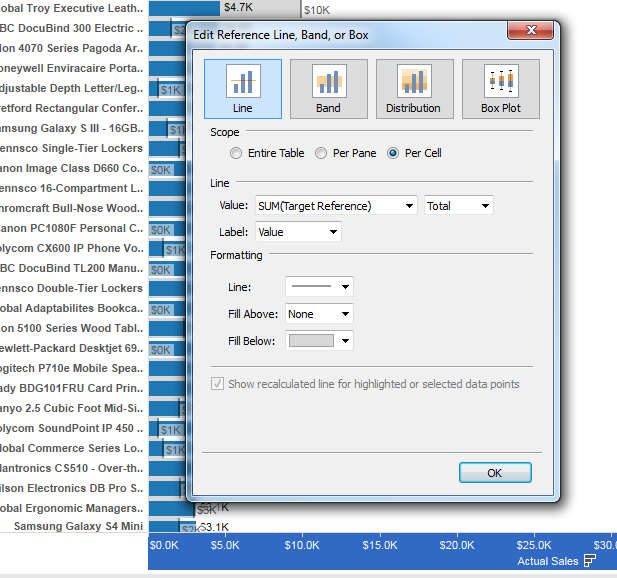
All Done! We can now easily see which products sales are ahead of Target, and which are behind, where the grey fill is still visible…
<Update Feb 2016: published a follow up post featuring a more challenging business scenario: https://insightsthroughdata.com/automate-target-to-date-attainment >
Pingback: Automate Target to Date Attainment | Insights Through Data