I skipped the Tableau conference last year as it was taking place in Vegas, and that is usually not a good experience, even without crowd shooters. I was happy to partake again this year to TC18, which took place in New Orleans.
 The conference was well attended with 17,000 attendees, yet it never felt overcrowded like it does when in Vegas. The trade-off is that the NOLA Convention Center requires a lot of walking: I clocked 9 to 10 miles a day of walking. It gets a bit frustrating to walk from one end to the other end of the venue to attend a session, arrive on time and see it is already full, which happened to me a couple of times when the topic was APIs…
In my opinion, those APIs were elements of one of the two overarching themes of the Conference: Tableau is opening up for real and Tableau Prep is out of Beta. Both those themes reveal how pragmatic Tableau has become lately. For years, they were dismissing those customers needs and requests from the community: nah, Tableau does not need to open up, it is good as it is, and i f you need something else, you don’t understand visual analytics. Nah, Tableau does not need data to be prepped, and Alteryx success is such an epiphenomenon which has nothing to do with us. But eventually, witnessing the rise of usage of the web connector, and the IPO of Alteryx, they started seeing the light and responded. And I welcome that change!
Tableau is really opening up
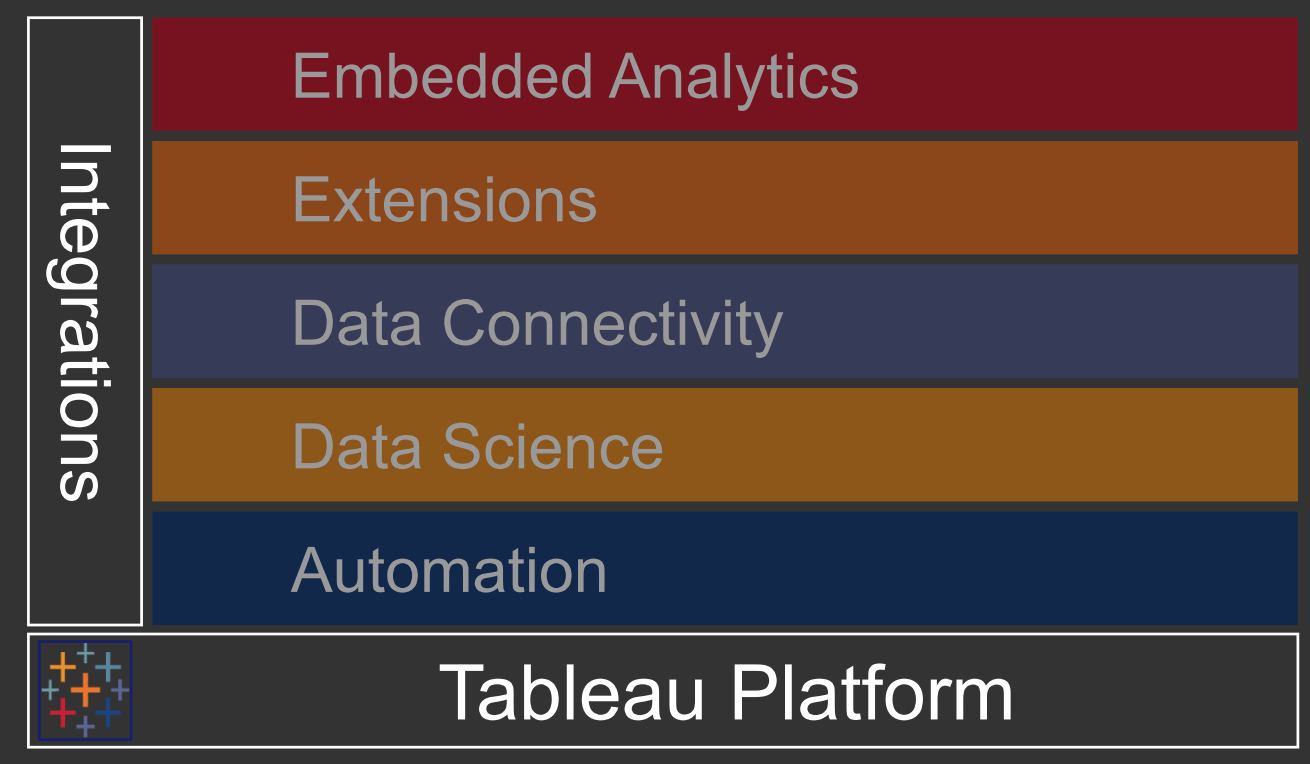
Take a look at the 439 sessions that took place during the conference, remove the enablement and Tableau in action tracks, you get down to 311 session, and I count 19 of them devoted to API or extensions. A big emphasis you put on this slide which demonstrates the efforts:
 The real stars were the Extensions API, available since summer 2018 and growing in maturity. The extension gallery counts 23 extensions as of today, and a majority is exciting because they functionalities feel like they should be part of the core product:
- Export All which enable a clean data export from a dashboard, is the second most used extension,from what I heard.
- Button Filter lets you position buttons on the dashboard to combine several filter values. It is a functionality I have been dreaming of, instead of having to duplicate dashboards.
- Show me More, the most used, FINALLY adds an easy to put together Sankey Diagram!
- DataRobot lets you easily insert machine learning capabilities into your dashboards! This is only their first version which describes your data set. Soon enough, a What If extension for sensitivity analysis is coming, and probably way more under way. Sensitivity analysis could be an important component that will help to play a part in the financial future of a business or project, and places like Synario, (https://www.synario.com/features/sensitivity-analysis) are already making great advances in this area. If it allows people to put a plan in place for their future, then surely this will be of great benefit to a lot of people? If you ask me, this is a game-changer to commoditize Machine Learning models use for the non data scientists among us..
- Write Back is also a very interesting approach, which lets users input data into the Tableau data source. It alone moves Tableau closer to tools like Anaplan, which can capture input from a large set of users, during a FP&A planning exercise for instance. Finance users still stuck in Excel should love that!
So what’s not to love, you might ask? I have the distinct feeling that Tableau has cut corners on their rush to deliver extensions, with regards to security. There are some security disclaimers when you activate an extension, and all extensions can be disabled from running on the Tableau server by an admin setting. That led me to ask presenters about the existence of a security scrub process by Tableau, before publication of the extension on their gallery. They painfully admitted there was no such process. It is therefore technically possible to sneak in some rogue code to siphon the data you publish in Tableau, and they will take no responsibility for it whatsoever. Hands washed… I find that appalling, as this will slow down the adoption of the extensions tremendously… As it is, I just cannot recommend their use to my customers, I would not want that liability… And I am not the only one:
https://vizninja.com/2018/11/01/on-tableau-extensions/
I subscribe whole heartily with Paul’s concerns… Apple is doing it for thousands of IOS Apps, why can’t Tableau do it for a handful of extensions? At least a subset could be stamped by Tableau as secure… I happen to have higher expectations from Tableau, and am still surprised by that miss… It is not like Data Security and Privacy are not top of mind these days…
Tableau Prep is getting ready for prime time
I wrote recently that Tableau Prep was an interesting research product, but unusable as it was released as a V1. One of the glaring misses was the lack of a scheduler to rerun flows in an operation environment. Well, I am happy to announce that my voice, along with many many others, was heard! Tableau announced Tableau Prep Conductor, a server module, still in beta (!), which will make it as easy to schedule a flow than it is today to post a viz on a server! They took their time, but it looks really good, and should give Alteryx a run for their money with their sorry Server/Gallery, way overdue for a makeover… But before that happens, Tableau needs to communicate the pricing for Conductor. I want to believe that it will be reasonable, at least at the beginning, to increase adoption. They floated on stage the figure of 10,000 Tableau accounts using Prep, which is pretty small out of the total 80,000 accounts mentioned in other circumstances. Especially since I am pretty sure that among those 10,000, there must be a majority of them who downloaded, kicked the tires since it’s free, and moved on pretty quickly.
I understand Prep needs to become a profit center eventually, that it took a lot of investment, but pretty please, Tableau, don’t go over $10k a year, if you want to keep me finally excited by Tableau Prep!! You even added easy integration of R and Python scripts, and a connector to Snowflake, my favorite database of all times!
And while I am positioning Tableau Prep asks, can you please add a connector to SFDC already? It is not a crazy ask, you have one such connector in Tableau Desktop since its inception, and their conference draws 10X more attendees than yours…
More announcements
There was a flurry of additional announcements for Tableau Desktop and Server, not all earth shattering, but worth mentioning…
Additional automation of table joins from data model: Tableau is adding more and more features to ease the transition from Excel for the less SQL educated of their customers. Basically, Desktop will leverage the data model meta data to suggest better joins, add related objects, and even deliver automated LOD formulas when the granularity of the join justifies it. To illustrate, let’s say you join Accounts table to Sales Orders, and add Account employees to the view, the number of employees would get multiplied by the number of orders for each account, unless you use a LOD to restrict employee counts to once per account. Those granularity issues are not always obvious and that assistance will help avoiding disasters.
Ask Data: the easiest one to demo, a kind of super charged Show Me which will enable users to type questions in natural languages and have Tableau generate the view. Quite spectacular, coming up with Version 2019.1. I reserve my opinion with regards to the usefulness, until I get to play with it on my own. Just like the features above, the goal is here is to lower the adoption threshold, pursuing the mission and promise of Self Service BI. It is well intended, but sometimes I worry about how this disconnects users from the underlying complexity of the data model, and might lead to more confusion. To use an analogy, an airline pilot should certainly use the auto-pilot and relax, but should know how to override, take over and manually control the plane commands.
Multiple Table Extracts: When generating a Hyper file, and formerly TDE files, multiple tables had to be flattened, which is fine when the relationships are 1:n or n:1, but becomes a problem when the relationship is n:m as every possible intersection needs its own record. This used to expand dramatically the size of those sub-type of extracts. This new optional type of extract will alleviate the problem, but keeping the join in the extract as explained here. This is definitely a welcome enhancement, but needs to be used in very discriminate ways, knowingly. Developers on Stage mistakenly claimed that that multiple table option always offered better performance when joining tables, which is plainly false. It is only true for n:m relationships, which are a minority of join use cases. for most other use case, this would be slower than a single table extract as the join needs to be performed each time the data source is getting queried, instead of only once when the single table extract is generated.
Other bags of tricks:
- Export to PowerPoint option in Download button will be offered, easily the largest crowd-pleaser. This exports a dashboard to a static PowerPoint file in one click, a great productivity hack, a bit overdue…
- Tableau Online will FINALLY get a usage data source, something Tableau Server has had for many versions. That really levels the playing field between those two options and I can now recommend Tableau Online to my customers without hesitation. This was really needed, to gauge the activity of users on Tableau Online, since every user needs a seat license, this will really help to optimize the spend on Tableau Online and increase confidence in that solution.
- Elements of the dashboards, such as filters, can be rendered transparent, and will ultimately have a toggle button to collapse them and reduce their footprint further. Dashboards will look prettier.
- Redesign of the Maps technology layer to use vectors. Will look much more like Google Maps. Nice…
- Filtered Nested Sorting to finally enable report users to sort on multiple nested dimensions. Also included are updates to the sort dialog, and toolbar sort button.
- Actions, Sets and Parameters got some deserved attention too, with additional integration, but I have to get my hands on it to assess how much of an improvement that really is, beyond nice demos.
- Supports for webhooks through APIs, as part of the Tableau Opening strategy. This will offer push from Tableau possibilities to web apps. This will allow to finally integrate with Slack! I am sure this will open many more possibilities. Can’t wait…
More announcements detailed here for what’s already available, or here for upcoming / beta.
Many sessions are available as videos here.

