I’m introducing a different type of post this week: still a tips and tricks style of post, but it stands against additional business context than usual, to be more relevant and applicable.
Sequence Analysis techniques and concepts originate from biology research, but they are actually very relevant in the field I am more familiar with: Marketing. Since a lot of Marketing analytics revolve around the understanding of customer behavior, it only seems logical that the sequence of the observed behavior comes to prominence. For instance, in most research scenarios, a customer who purchased a music album on iTunes after watching a video of the artist on YouTube, should be segmented differently than the one who purchased that same album and then proceeded to watch the same YouTube video: the sequence reveals most certainly a different causality between those actions.
Now, unlike biology where sequencing applies to strings of nucleic acids, sequencing in marketing implies trying to identify trends within large amounts of transactions, using reference time/date stamps. Here are some examples:
- Combing through weblog data such as Google Analytics, to understand the paths taken by visitors among the pages or actions on a web property, to optimize their experience and drive them towards a favored outcome, such as purchasing in e-commerce.
- Analyzing Marketing Automation data such as Marketo, Eloqua, Pardot to identify the combined impact of marketing campaigns in sequence. Is a free trial campaign performing better after or before a webinar to introduce the offer? Is there a Golden Path of campaign touches that will convert a prospect to a customer in a minimal amount of time at a minimal cost? It is also interesting to note that the effectiveness of an automated marketing campaign can vary depending on the industry in which it is launched. For example, in the finance sector, using marketing automation tools can be a fantastic way to curate a personalized approach to marketing involving custom emails and text messages for instance. In other industries, alternative approaches might have more of an impact.
- Monitoring and maintaining Customer Relationship to prevent churn in subscriptions using predictive models for instance, using CRM data (SFDC, SAP, Microsoft Dynamics, Oracle…)
- Integrating your marketing solutions together (e.g. finding a way to integrate SMS for Microsoft Dynamics) to help improve your marketing efforts and getting people to pass through the customer journey funnel as quickly as possible.
- Recommendation Systems to evaluate what is the most relevant next purchase for a customer, using predictive models here again, feeding from past transaction sequences, like seen on Amazon, the uncontested pioneer in that field.
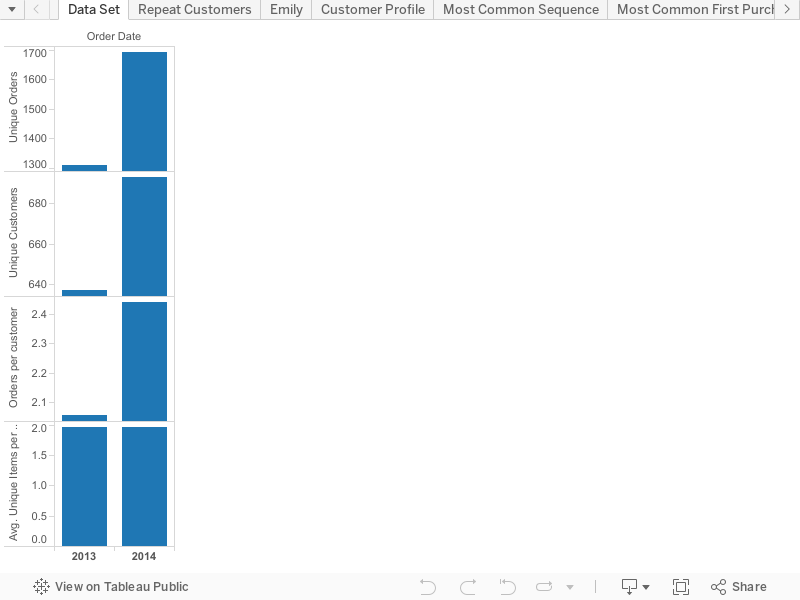
In this first post on Sequence Analysis, I will use the last scenario of purchase analysis leveraging the standard Superstore dataset. The purchase transactions look like this:
 And we will look specifically at the product sequence pattern.
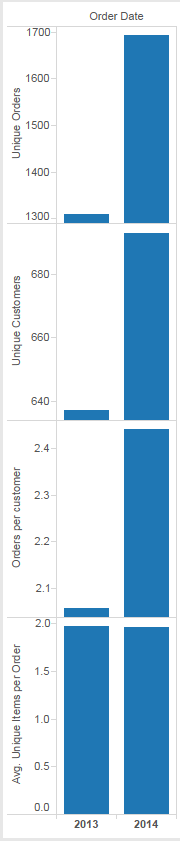
Looking at the data set with a product angle, it looks like years 2013 and 2014 should be most interesting to study, as they reflect a high level of repeat customers, with an average of over 2 orders per customer, and 2 distinct products per order:
 Now that we have established we have repeat customers, it is quite easy using Tableau to identify who are the best customers by ranking them:
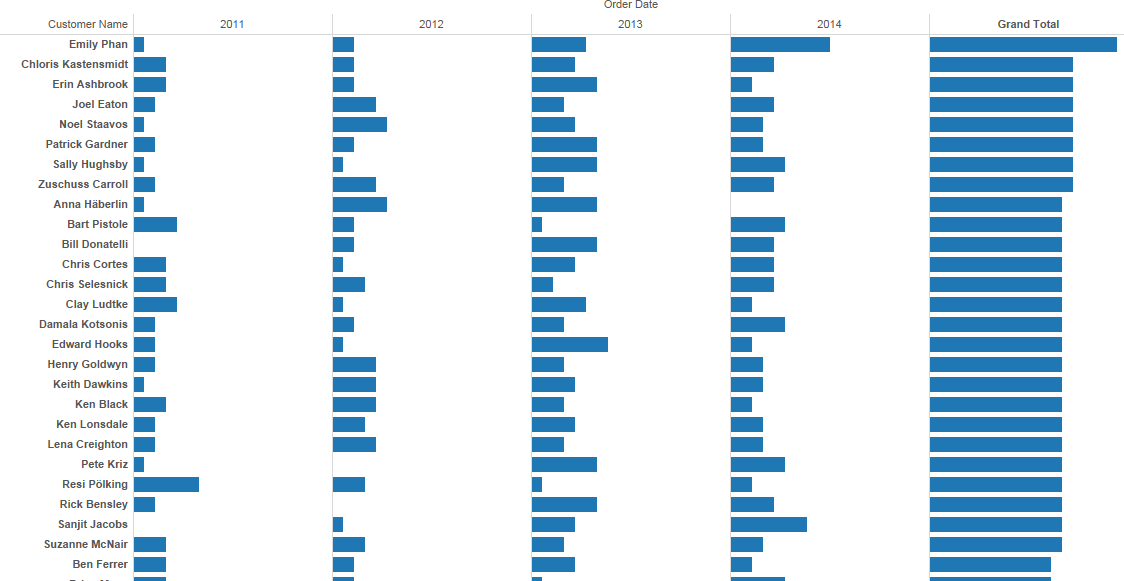 Emily tops them all with 14 orders, but now, which products did they buy and how do we establish the sequence of products they bought in 2013-2014? Here again, Tableau can display what Emily bought in a couple of clicks, counting unique orders here:
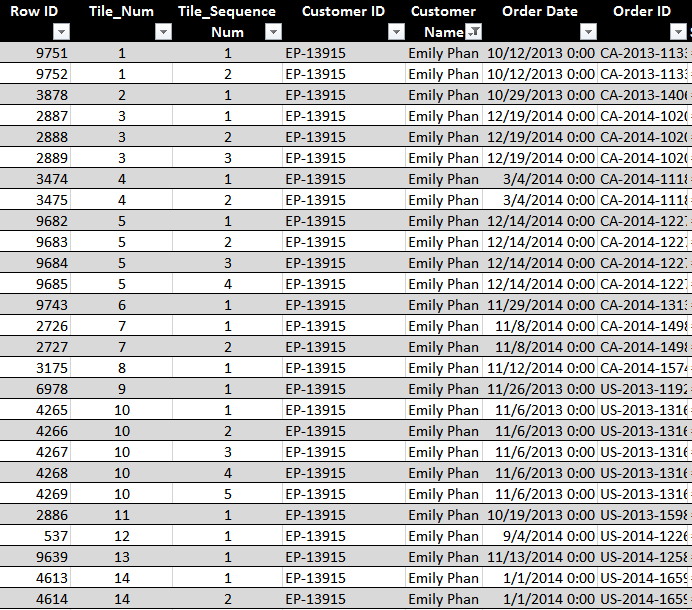
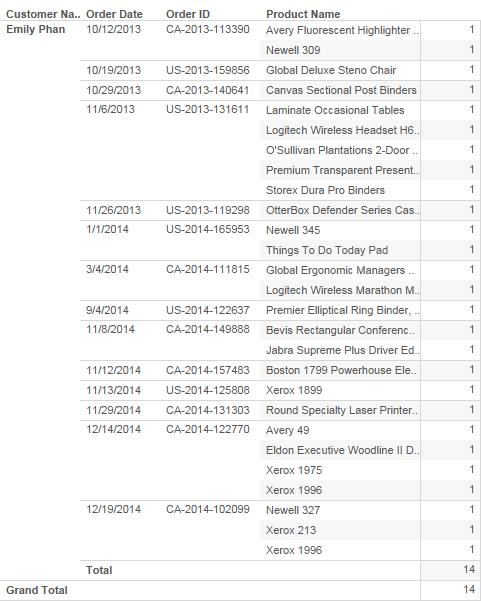 But to scale the analysis to all customers, it would be much easier to obtain a sequence stamp which would identify the rank in the sequence. The goal today is to add a rank in the sequence as illustrated in the first column, using only the fields populated below:
 Ignoring Order ID for the time being, on a time subset of the data set (2013+2014), while keeping all the other transactions’ attributes unadulterated, as they will be used for segmentation or filtering during the analysis.
Fortunately, Alteryx provides an easy way to reliably prepare this sequence stamp, and update on demand, using the Tile tool in the preparation tab:

Here is how the Alteryx workflow would work:
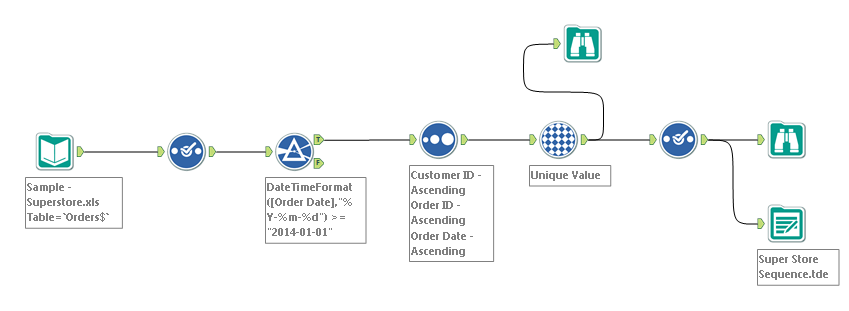
- Load Super Store transactions
- Use Select tool to reorder, rename if necessary
- Filter out transactions outside the defined time window: here we take only 2013 and 2014 and ignore 2011 and 2012
- Sort transactions by Customer ID then Order Date
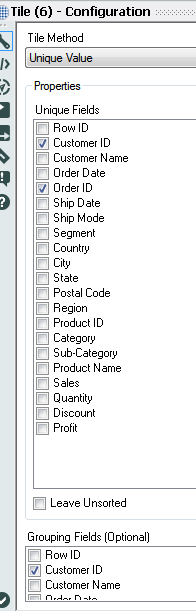
- Tile the transactions using this configuration:
- Obtain two new columns called Tile_Num and Tile_SequenceNum which match the requirements:
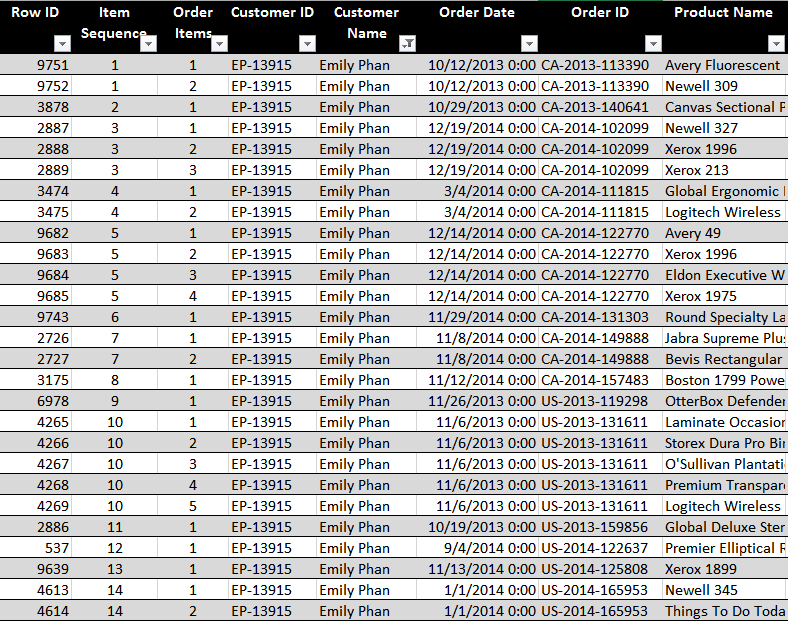
Note that our example Emily has been processed properly with 27 items purchased, but all items part of the same orders are assigned the same sequence number since they were purchased simultaneously. - Rename Tile_Num and Tile_SequenceNum respectively to Item Sequence and Order Items:
- Export prepared data set to a unique TDE file ready to be analyzed in Tableau
The whole workflow runs in 5 seconds…
Now what do we see in Tableau? Lets rank the most common sequence steps by collating the Item Sequence # with the associated product:
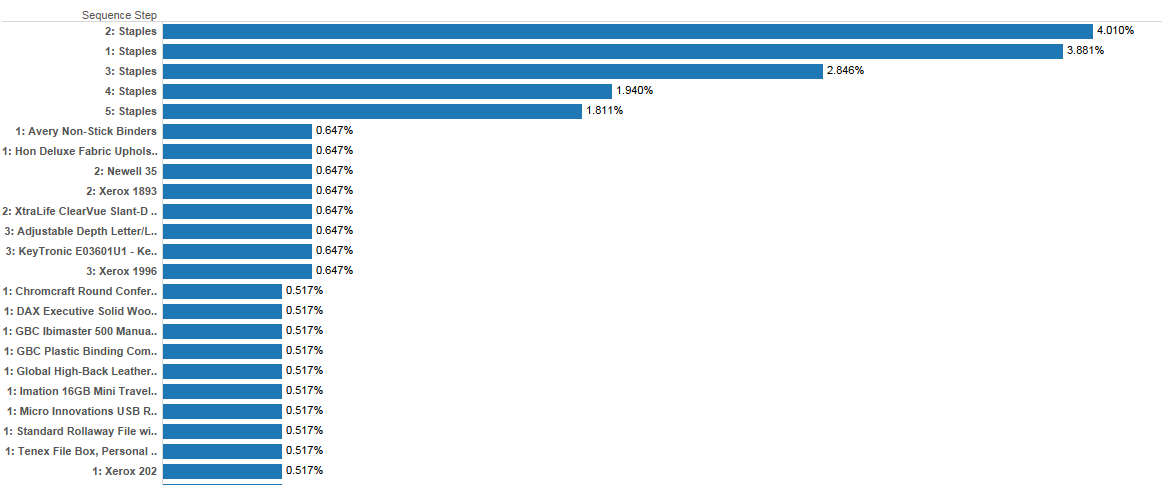 It looks like Staples is found in many customer sequences, let’s see what’s the most common first purchase:
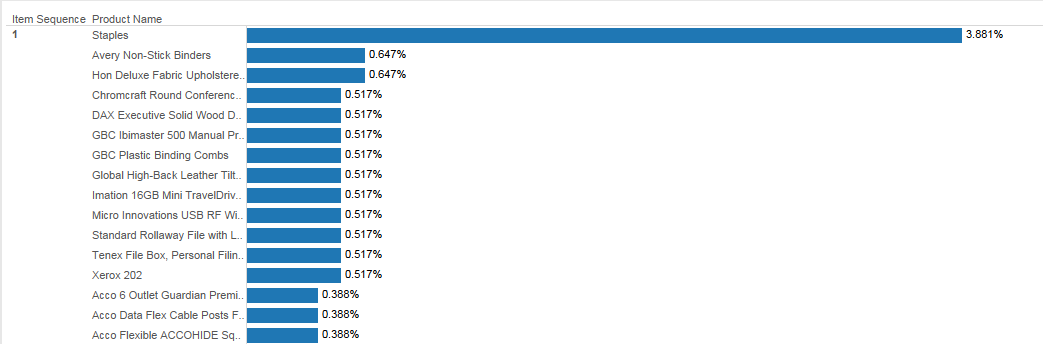 This confirms that Staples is found in the first order for almost 4% of the customers. Is it true across customer segments? Let’s break it down:
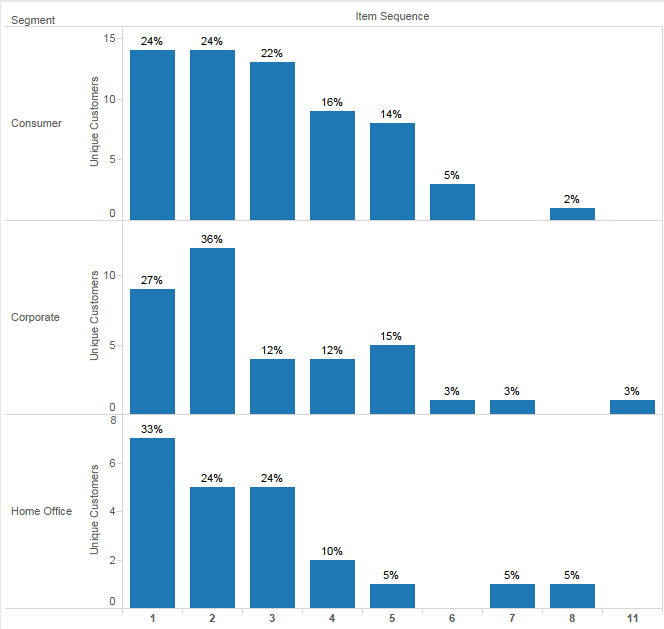 For 33% of Home Office customers, staples were in the first order. For Corporate customers, it was only 27% and 24% for Consumers. If this data set was real, it would tell us:
- Staples are a relevant attach item to be promoted as order add-on for Corporate customers, by providing for instance a reminder before validating an order for instance: “did you remember to replenish your staples”?
- Staples are a good item to draw Home Office customers in, and could be considered as loss leaders in promotions to bring in new Home Office customers.
This opens countless analysis opportunities, and the next step in further posts will be to look at the data set from a Order perspective. Last I will insert some predictive aspects applied to the next items or customers to transact.
In the mean time, the Alteryx workflow can be downloaded from here, and the Tableau workbook is available here: