
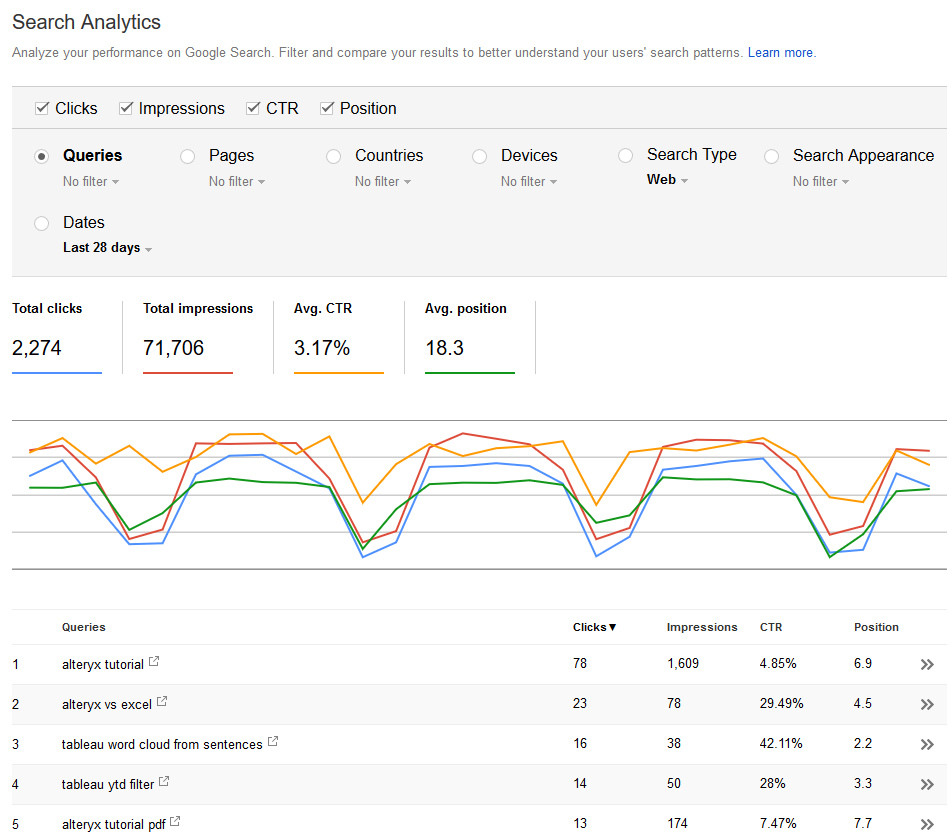
Whether you are deeply versed in the intricacies of SEO, or simply curious to optimize your web property’s organic search performance, you must likely are involved with the Google Search Console and its analytics. It is a very useful (and free!) tool to understand how users reach your website through a Google Search, and will help you ground your intuitions with facts: diagnose traffic and search position changes, find opportunities for optimizations and content ideas. Must Have for webmasters and digital marketers. If you want to learn more about your site’s traffic and any SEO health issues that it may have then this SEO checker is the ideal tool for you – https://www.ninjareports.com/seo-checker/. This will help you devise a strategy for increased success with your site. This sort of analysis can give you a visual representation of your site’s metrics and performance. Here is how it looks like for the very blog you are reading:
 It even comes now with a fresher look and better filter ergonomics:
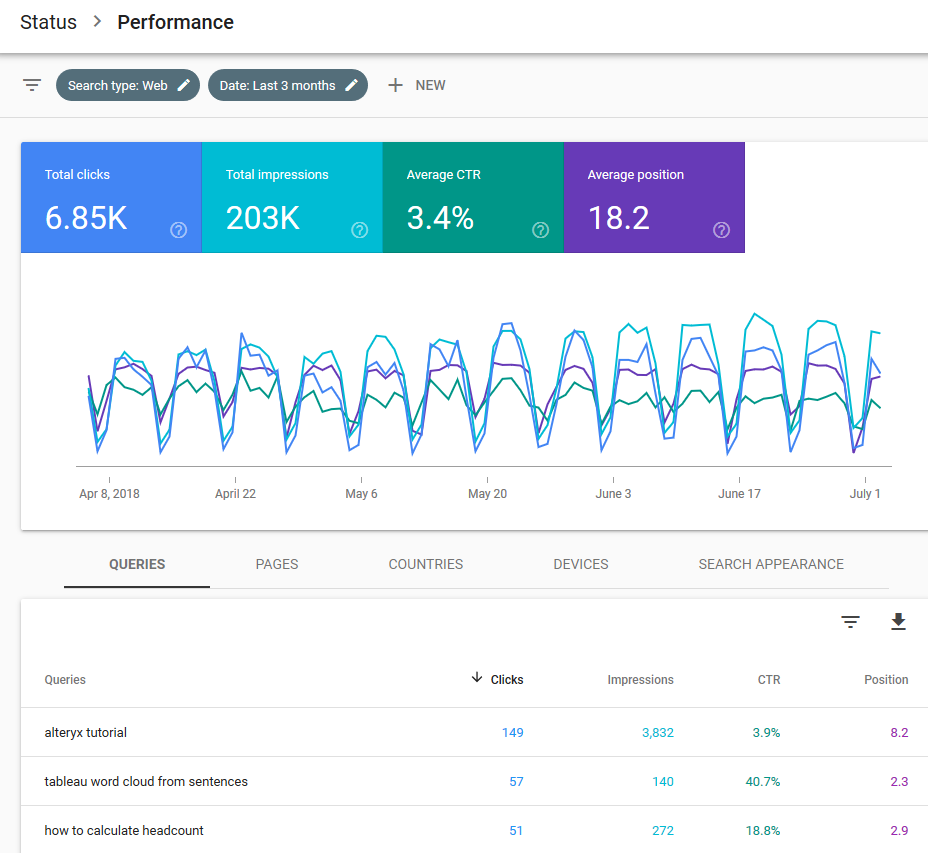
That new version lets you access up to the last 16 months worth of data, all the way until today-2 days. The legacy version was offering only 90 days. Each transaction is structured around 7 dimensions:
- Date
- Query
- Page
- Country
- Device
- Search Type
- Search Appearance, of little use
and 4 indicators:
- Impressions: How many times was the web page served into the displayed results of the Google Search
- Clicks
- CTR: Click Through Ratio calculated from Clicks/Impressions
- Position: How high on the Google Search results page did the page appear
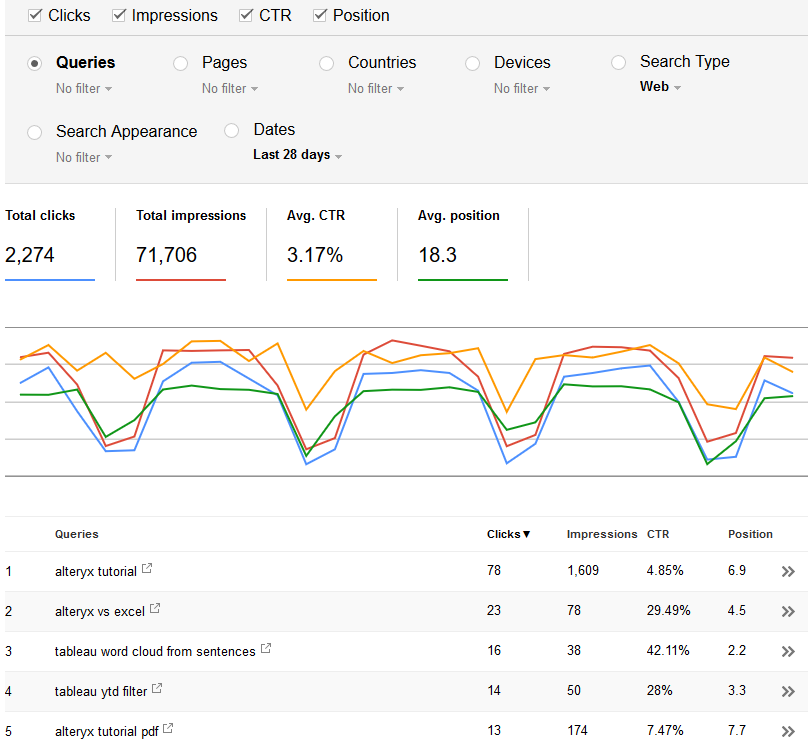
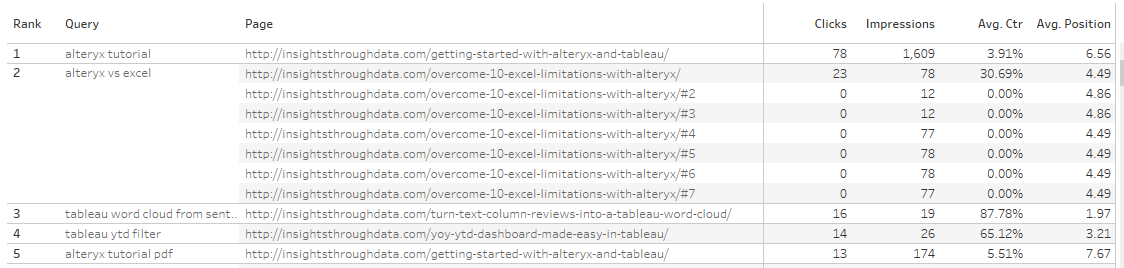
Overall the Web UI is decent and responsive. Alas, it suffers from grouping and sampling issues, just like its Google Analytics peer. Let’s take an example: you can’t display a list of all the keywords in Search Analytics and their corresponding landing pages. You would have to filter query-by-query to see their associated landing pages, or page-by-page to see their queries. Here is an illustration of my top 5 Queries:
 And now my Top 5 Pages:
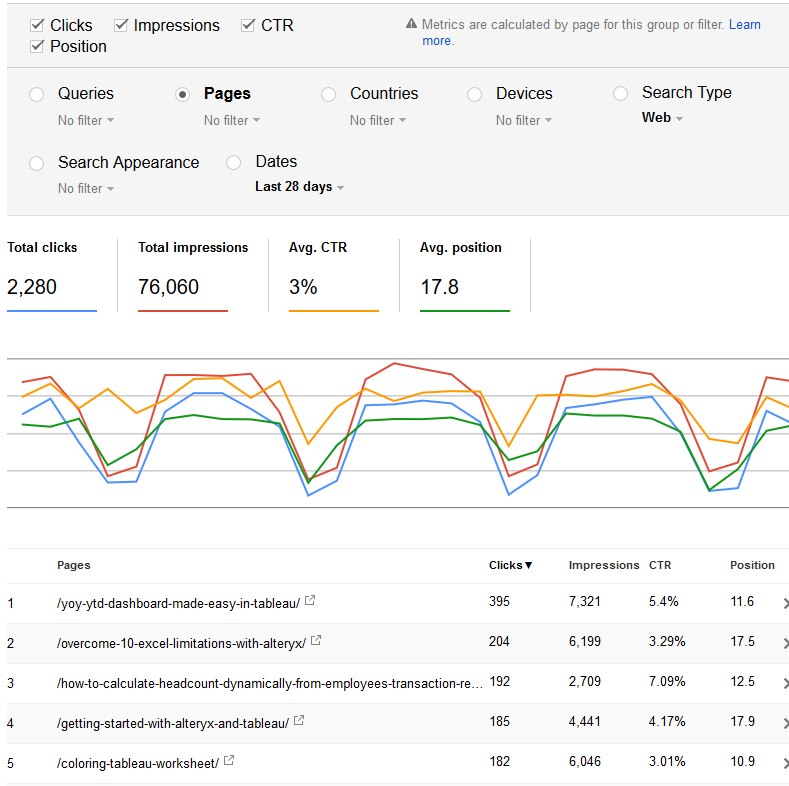 But impossible to get the pages for my top 5 queries…
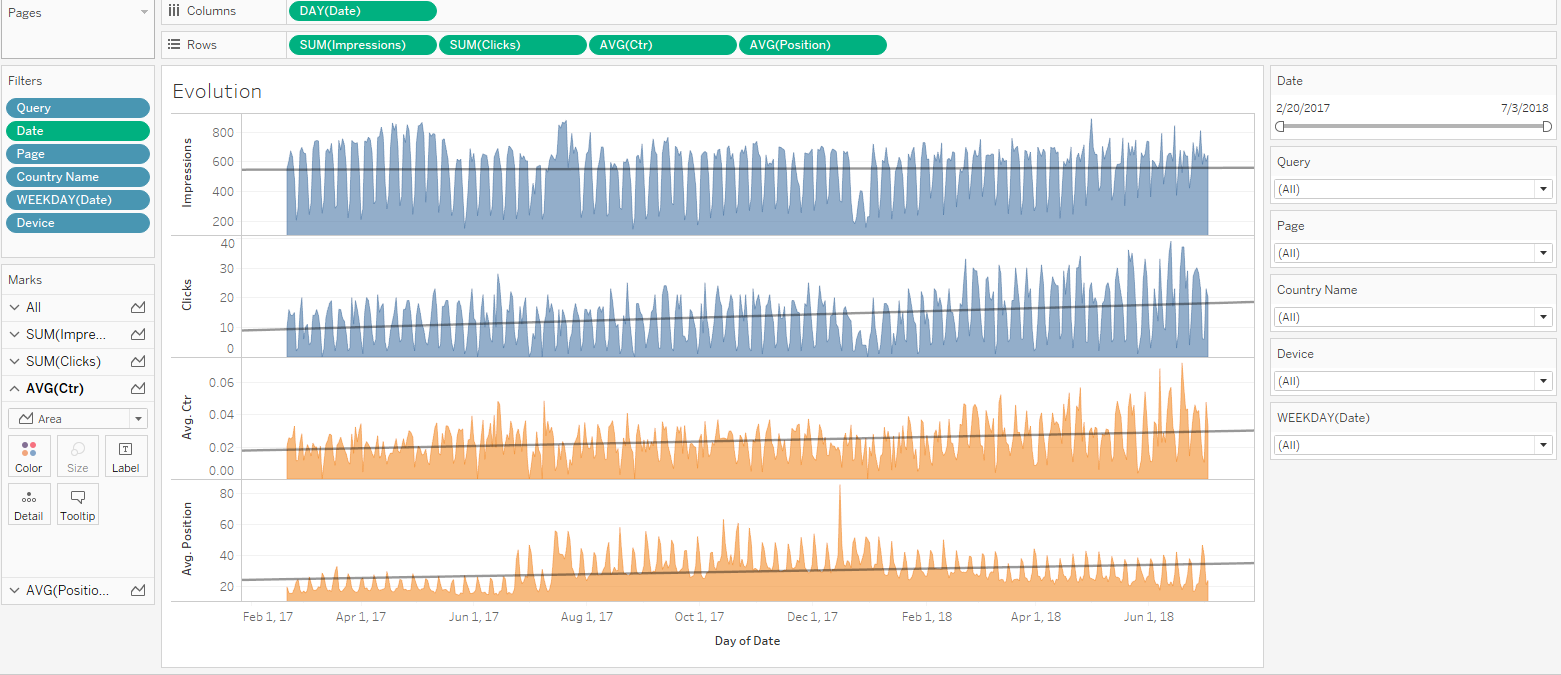
This sounds like a mission for Tableau:
 I can then get all the features of Tableau to build whatever I need with the whole 16 months of data, that I can stockpile going forward:
Achieving that type of view requires to feed Tableau with good transaction data, out of the Google Search Analytics API (GSA API for short). That API will give us full control over filters and grouping, and we will be able to avoid sampling as well, since we won’t group by page : “When you group by page and/or query, our system may drop some data in order to be able to calculate results in a reasonable time using a reasonable amount of computing resources”. The strategy we will follow is to make one call by day, as detailed here. There are 2 ways to get the data to Tableau. we will cover the quick & dirty approach through Google Sheet, appropriate for a one shot analysis, and the thorough approach through API in Alteryx, appropriate for long term operations.
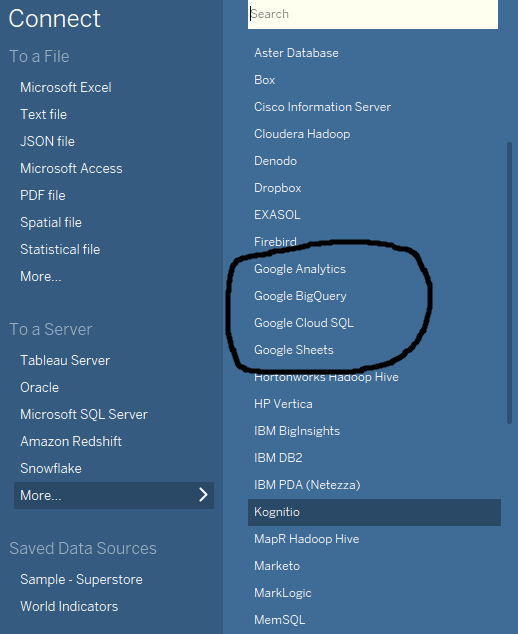
Let me first address questions related to alternatives: yes, you can export CSV transactions from the GSA UI and let Tableau ingest the flat file, but it doesn’t address the problems of grouping and sampling, as detailed above, since the CSV transactions extracted are grouped. But then, why not connect Tableau directly to the GSA API? Well, unfortunately, the GSA is missing from Tableau’s current connectors offering:
Quick & Dirty: Use Google Sheet to load detailed transactions to Tableau
We will make good use of Tableau’s Google Sheet connector though, thanks to that free slick app: Search Analytics for Sheets. that extension of Google Sheet will go query the API on your behalf and dump the output in a sheet. Then all you need to do is to connect Tableau to that Google sheet with the desired transactions. It’s free, and if you don’t run into authorization issues, you can probably get something up and running in a matter of minutes.
This is a handy solution, simple, well documented and did I mention it is free? Yet, you really are dependent of whatever level of data transformation and blending that can be done in Google Sheet. Note that you could also use Alteryx and its Google Sheet connector to blend and load into a database. Nevertheless, I don’t know how reliable that extension is for ongoing operations. By removing the complexity, that solution also removes some levels of control. Hence, I’d rather use a more involved solution to better understand the API and the data I will analyze.
Thorough & Controlled: Use Alteryx to load detailed transactions to a database, accessed then by Tableau
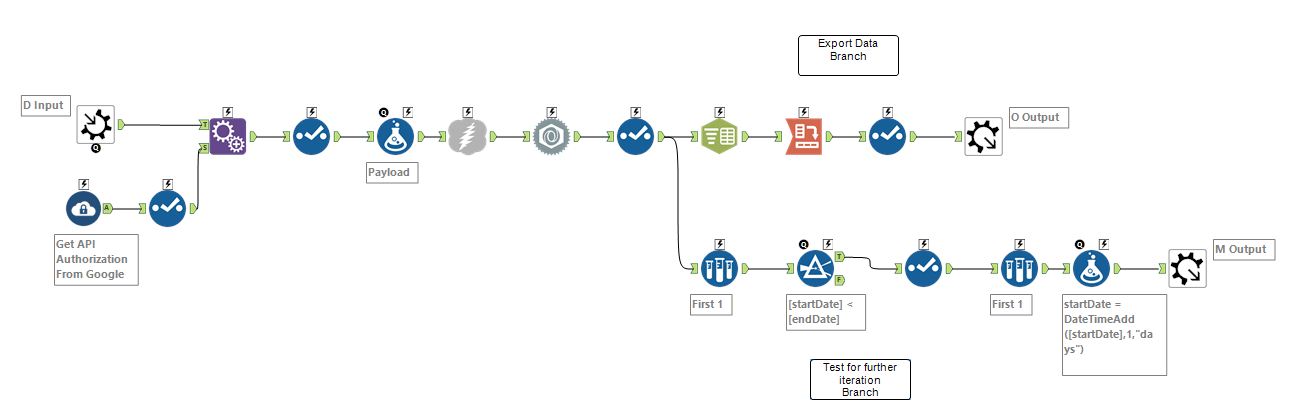
In order to avoid sampling, the logic to use here is to have one workflow I called Query Google Console Daily, controlling an iterative Macro which will query the GSA API one day at a time, and will proceed to assemble (=Union) all the transactions for the time frame you requested into the Search Date Parameters. Those transactions can then be loaded them into a destination of your choice (database, CSV, Excel file…):
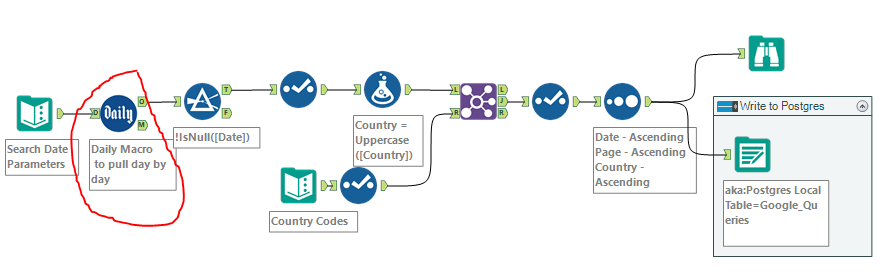
and the iterative Macro called Daily which runs for each day between the Start and End Date input:
 The first time you use that iterative Macro, make sure to input the website you will track into the Payload formula tool. First things first, get the exact spelling of the website, as Google understands it by looking into the Search Console:
Note the slash at the end. For a regular website of type http:// the API accepts short versions format: ‘https://www.googleapis.com/webmasters/v3/sites/insightsthroughdata.com/searchAnalytics/query’.
It gets trickier if the website is Secured, type https:// , as you need to include the protocol. For instance, if I want to track https://techcrunch.com/, the code will look like this: ‘https://www.googleapis.com/webmasters/v3/sites/https%3A%2F%2Ftechcrunch.com%2F/searchAnalytics/query’
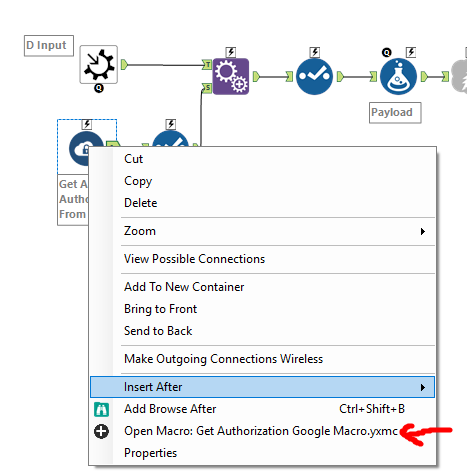
Another initial setting needs to be applied once: your Google API Credentials for the Console, which are located inside yet another Macro called Get Authorization Google Macro.yxmc within the Daily Macro, that you reach by right clicking:
and proceed to input your credentials (ID, Secret and Refresh Token) into the Text Input Tool:
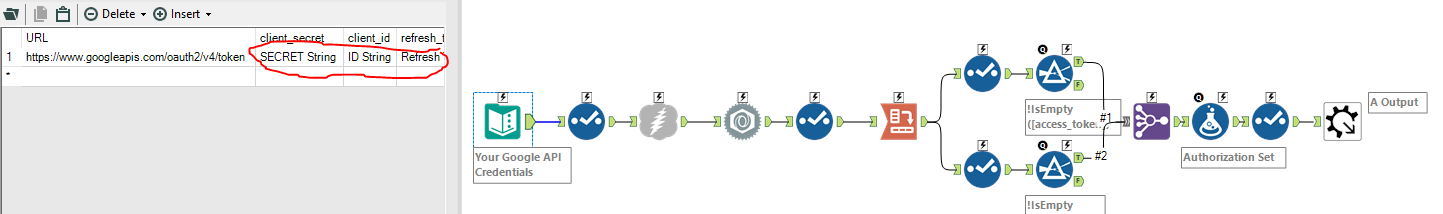
If you don’t know your Google API credentials, this guide will walk you through the steps to obtain them. It’s easier and faster than it looks.
Overall, the use of the API, liberating us from the standard issue analytical tool Google provides, opens many opportunities, beyond sheer archival.
Consider the blending possibilities with an E-Commerce scenario, for instance. If the website is structured with one page per product, à la Amazon, you could blend in your product hierarchy and perform analysis by product category or by product lifecycle! E-commerce websites can use additional resources such as https://fastspring.com/blog/the-comprehensive-guide-to-subscription-revenue/ to help manage this area as well.
The workflow can be downloaded here.
Hej, thank you very much for this!
I used the Alteryx flow, but i came across a few errors before i got it working. First the URL field got truncated, because it was a string and the size was set too low and kept getting the 404 error back. Took a while to see that the url was cut of at the end..
After i fixed this i kept getting a 400 error saying my siteUrl was not correct, but after trying it a hundred times (different sites, with https and without) and i knew this couldn’t be the problem. In the end it was the “Encode URL Text” setting checked in the Download tool that caused this. By unchecking this it finally worked! 🙂
I tried this workflow a few months back and couldn’t get it working either, but i assumed i was doing something wrong with the Oauth part.
Hi
I’m not entirely sure that you don’t lose data using this method. According to google, you will always loose a level of data once the page and query dimensions are included.
Still, this is the way forward. nice work.