
This post is most certainly more relevant to Tableau beginners coming from Excel, but advanced Tableau users might still find some value, since the question looks easy but turns out the solution is less than obvious…
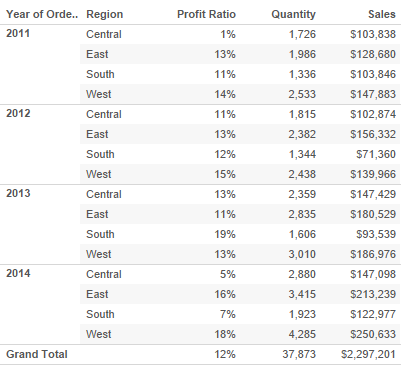
As I was presenting a view as a text table, looking much like an Excel spreadsheet, a user asked whether I could color one specific column / measure to make it stand out, the same way you would in Excel in 2 clicks. Namely, how to go from this:
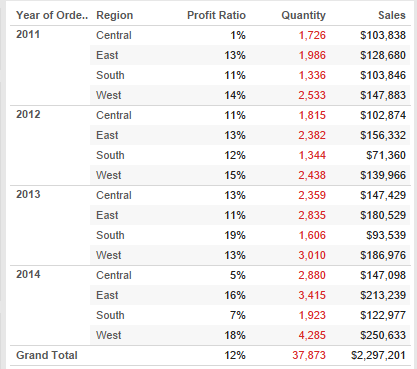
to that:
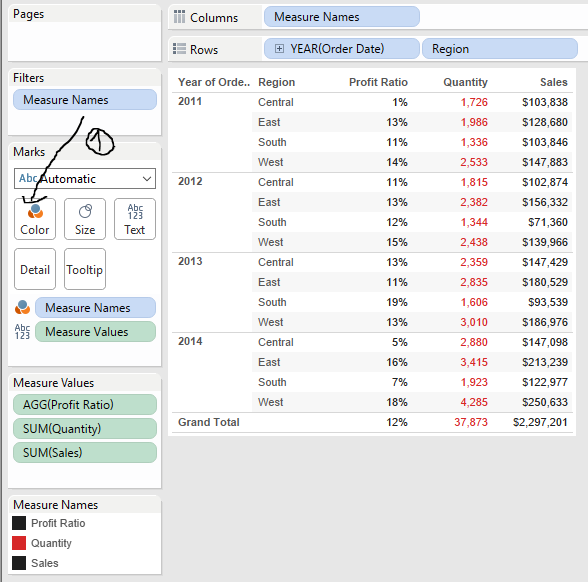
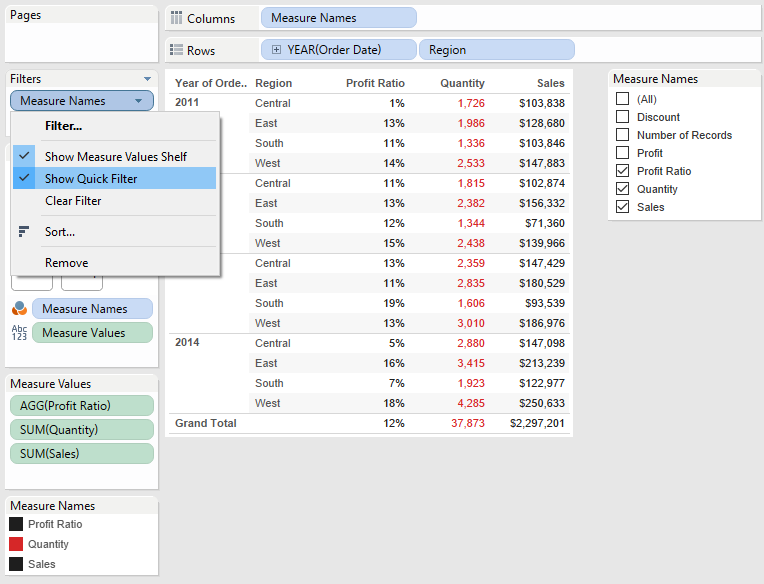
I must admit it took me one hour to find how to do it in Tableau… But once you know, it’s 2 clicks as well, just like Excel:
- Drag the Measure Names pill over the Color Box, while pressing the CTRL key
- Adjust the Colors for each Column / Measure.
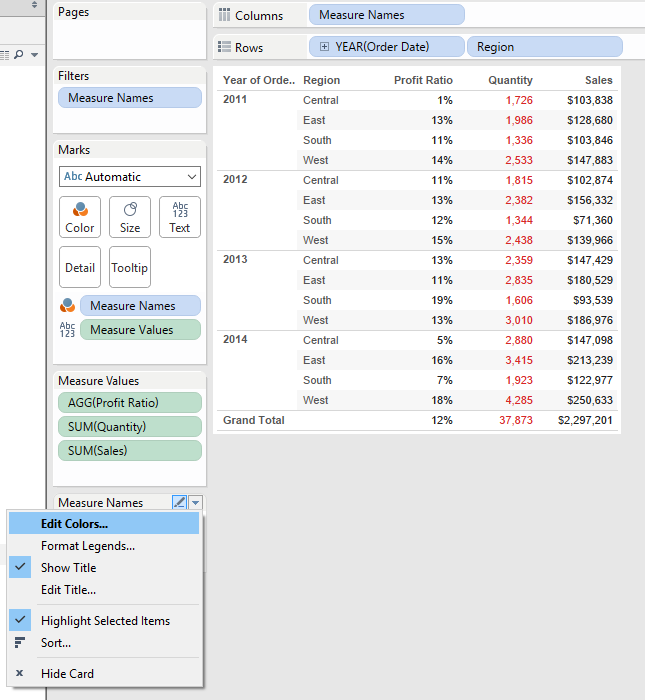 Should the Color Legend not be visible, go to menu Analysis / Legends and select Color Legend
 - You can even let the end user pick which columns / measures to display by enabling the Quick Filter on the Measure Names
To dwell further in Excel territory and use conditional formatting, to highlight specific values in a long list, you can use the combination of Square mark and color. In this example, the losses are highlighted in red:
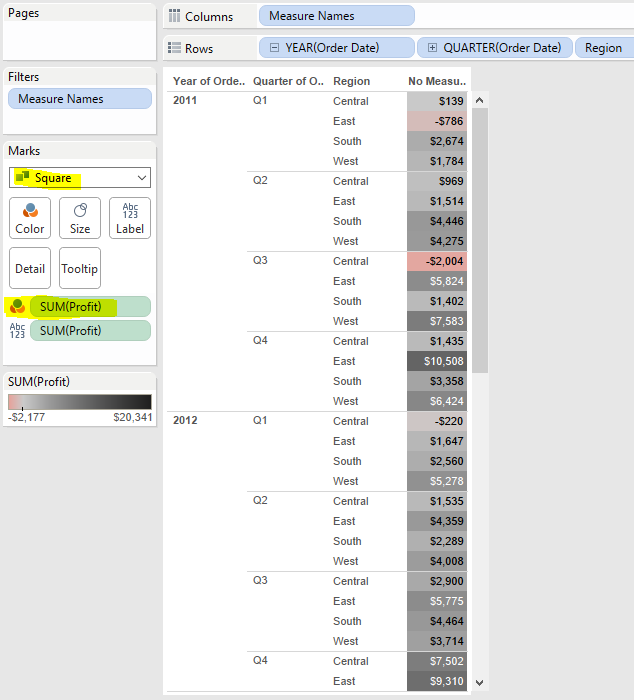
This is a very useful technique. Thanks for sharing! One thing to point out is that the square mark fills the space when you use a continuous (green) field on the Color shelf. If you use a discrete (blue) field, like Measure Names in your original example, then you’ll see a small square that doesn’t fill the space.
A possible workaround in those cases is to create a calculated field with code like AVG(1) and then use that on Rows to get an Axis, set the mark type to Bar and then adjust the size of the bar and the range of the axis so that the bar fills the entire view.