
A simple user inquiry sent me recently in a spin and got me to doubt my Tableau skills:
“Show me all the Leads who have responded to Marketing Campaign 1 AND Marketing Campaign 2 within the month”
I thought it would take a couple of clicks in Tableau to answer that question, but then I realized something was really amiss when I keep getting NULL results, which was not a likely outcome when applying business logic.
It turns out the data was structured as simple transactions of this type:
Lead A/Campaign 1/Response Date
Lead B/Campaign 1/Response Date
Lead A/Campaign 2/Response Date
And here is where the obvious quick approaches misfire:
- Using a simple filter on Campaign with values 1 and 2 selected would give the whole list, even though Lead B does not belong. It is obviously a OR/Union, not the AND/Inter I am looking for…
- Using 2 Sets on Campaign, one for Campaign 1 and one for Campaign 2 and get the intersection results in no Leads when selecting both IN, since no transactions can combine more than 1 campaign…
If you don’t believe me, Use the Tabs 1 and 2 in that Workbook using customer transactions by Category from the Superstore data set and see for yourself:
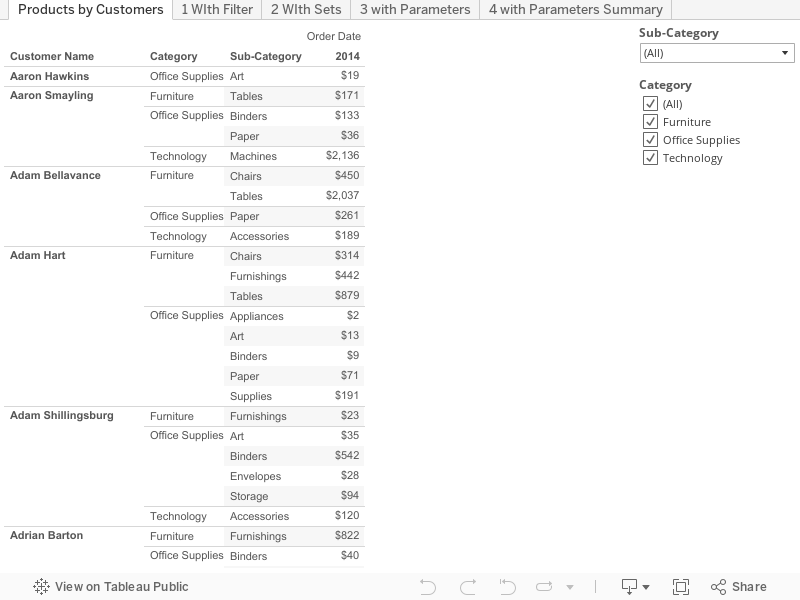
After further reflection, I realized this was the same premise as the Market Basket Analysis! The analogy is customers transacting products by category instead of leads responding to campaigns. I try in the workbook above to identify customers who ordered in 2014 items in Furniture AND Technology Categories. In both case, each transaction is independent from the next and can have different dates. I also recalled having solved a similar problem following a Tableau article covering exactly that issue:
http://kb.tableau.com/articles/knowledgebase/market-basket-analysis
Unfortunately, the approach is not really elegant, using a Self-join that only works with the old Jet version of the Excel connector, and looks pretty outdated too, not referring in any ways to the amazing LOD possibilities. I could not apply it connecting to a single source system, which is not an Excel spreadsheet (!). I could not find any recent reference to an approach to solve this basket analysis example using LOD. Nonetheless, with the help of the Tableau forum and Shin Murakami, here is a working solution using the always versatile Parameters, I will detail here and illustrate with the Superstore data set reading from a single TDE data source:
- Right Click on Category and create a parameter, call it Category 1
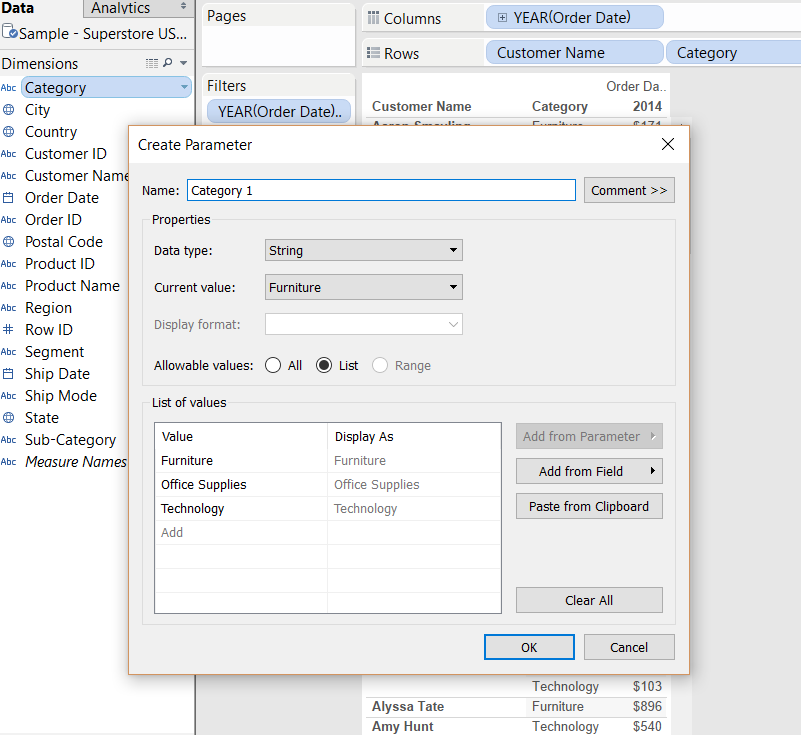
- Right click on Category 1, duplicate, and rename it to Category 2
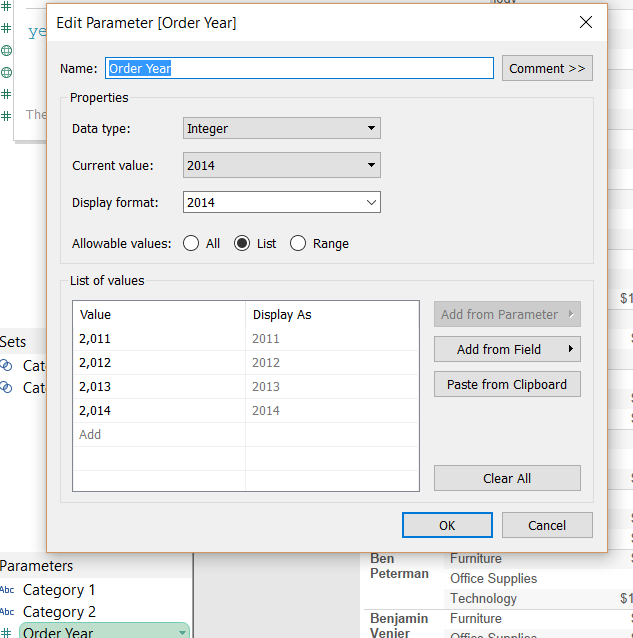
- Create Order Year Parameter:
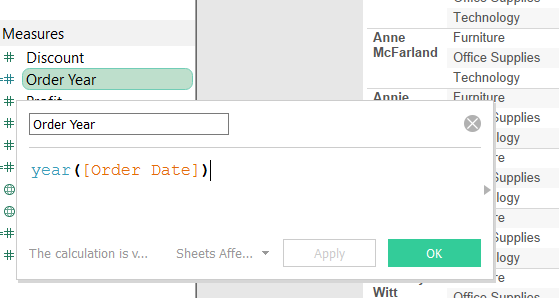
- Create Order Year Measure:
- Right Click on each new parameters and select Show Parameter Control
- Select Furniture for Category 1, Technology for Category 2 and 2014 for Order Year
- Create a Category Filter:
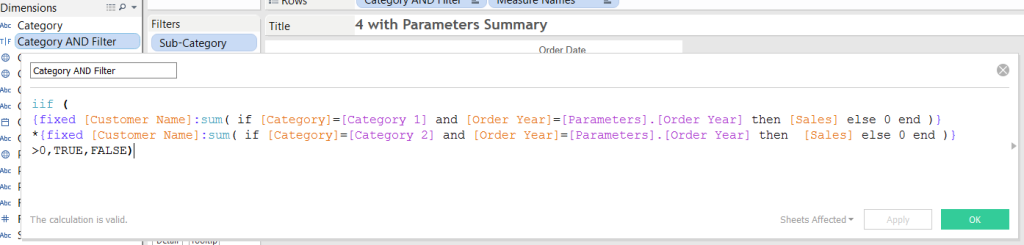
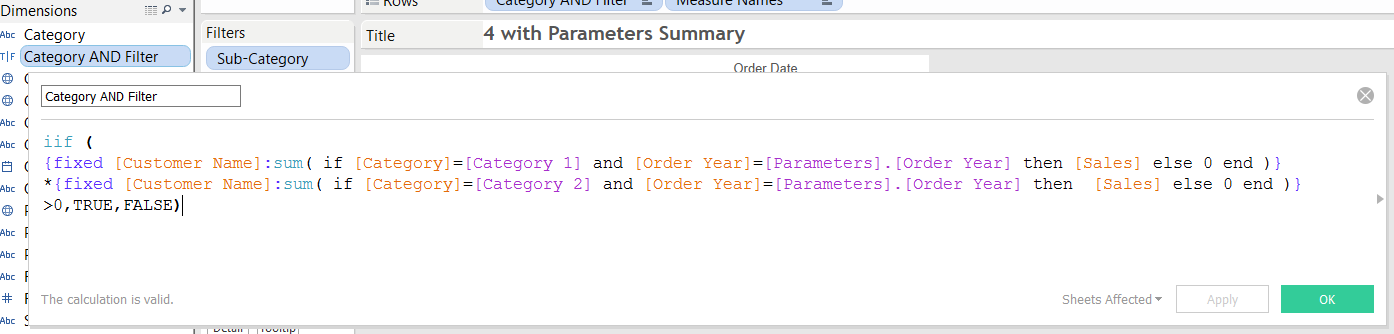
Here is the code ready to paste:
iif (
{fixed [Customer Name]:sum( if [Category]=[Category 1] and [Order Year]=[Parameters].[Order Year] then [Sales] else 0 end )}
*{fixed [Customer Name]:sum( if [Category]=[Category 2] and [Order Year]=[Parameters].[Order Year] then [Sales] else 0 end )}
>0,TRUE,FALSE)
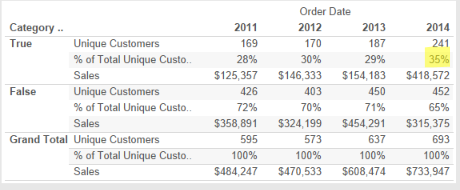
That’s it! After dragging the Category AND Filter to the Filter shelf and set it to TRUE, you will see only the matching customers, as illustrated in Tab 3. Note that Customers don’t even need to be listed, as seen in Tab 4, where you have a nice summary that shows that 35% of customers had bought in 2014 in both categories, Furniture and Technology:
Hello Frederic-
Great work! I actually used your Market Basket Analysis process from your prior post (that you label as “not very elegant,” although it enabled me to do exactly what I was banging my head against the wall to try to do). I used this to perform a co-investor analysis to determine how many deals two selected investors were both involved in, where the data structure is similar to the data you are working with here: each record represented a single investor in a single deal, hence the number of records for a given deal was equal to the number of individual investors.
By performing the self-join, I was able to create a nice heatmap showing the numbers of unique deals across the investors, much like the heatmap you show in the prior post.
So, now I am wondering if there is a way to extend this latest approach across a set of entities rather than simply for selected items using parameters so I can populate the heatmap without the need for a self-join. If so, this would be a huge benefit to me. I would love to chat with you about this possibility if/when you have a chance.
Jeff Carlson
p.s. – I believe you and I met at one of the recent Tableau meetups
Wonderful, Nicely explained… Let me work on a similar market basket problem that I have been scratching my head with and update you.
Is there a way to extend the filter if I want to analyze a basket of up to 10 items?
I don’t see why not… Instead of 2 multipliers in your formula, you will have 10…